
Why Conversion Rate Is So Important For Your Amazon PPC Profits
Table of Contents
Your conversion rate directly impacts every aspect of your Amazon PPC campaigns, determining whether your ad spend generates profit or loss. For Amazon sellers running PPC campaigns, understanding conversion rate isn’t just helpful—it’s essential for success. When your ads convert well, you spend less per sale, rank better in search results, and create a positive feedback loop that improves both your advertising and organic performance. This article explains why conversion rates matter so much for your Amazon PPC campaigns and provides actionable strategies to improve them.
What is Conversion Rate in Amazon PPC?
Conversion rate measures how many people buy your product after clicking on your ad. It shows if your advertising is bringing in the right customers. In Amazon PPC, conversion rate is calculated by dividing the number of sales by the number of clicks on your ads, then multiplying by 100 to get a percentage.
The formula looks like this:
Conversion Rate = (Number of Orders ÷ Number of Clicks) × 100
For example, if 100 people click on your ad and 15 make a purchase, your conversion rate is 15%. Amazon refers to this metric as “Order Session Percentage” in your seller reports. This number tells you how effectively your product listing converts visitors into buyers.
There’s an important difference between your overall conversion rate and your PPC-specific conversion rate. Your overall conversion rate includes all traffic sources—organic searches, direct visits, and external links. Your PPC conversion rate only counts visitors who came through your paid ads. The PPC conversion rate often differs from your overall rate because paid traffic has different characteristics than organic traffic.
Amazon measures conversions within a specific attribution window, typically 14 days. This means if someone clicks your ad and purchases within two weeks, Amazon counts it as a conversion for that ad. Understanding this timeframe helps you properly evaluate your ad performance, especially for products with longer buying cycles.
The Direct Impact of Conversion Rate on PPC Performance
Conversion rate fundamentally shapes the success of your Amazon PPC campaigns by directly affecting your key performance metrics. When your conversion rate improves, your advertising becomes more efficient and cost-effective across the board.
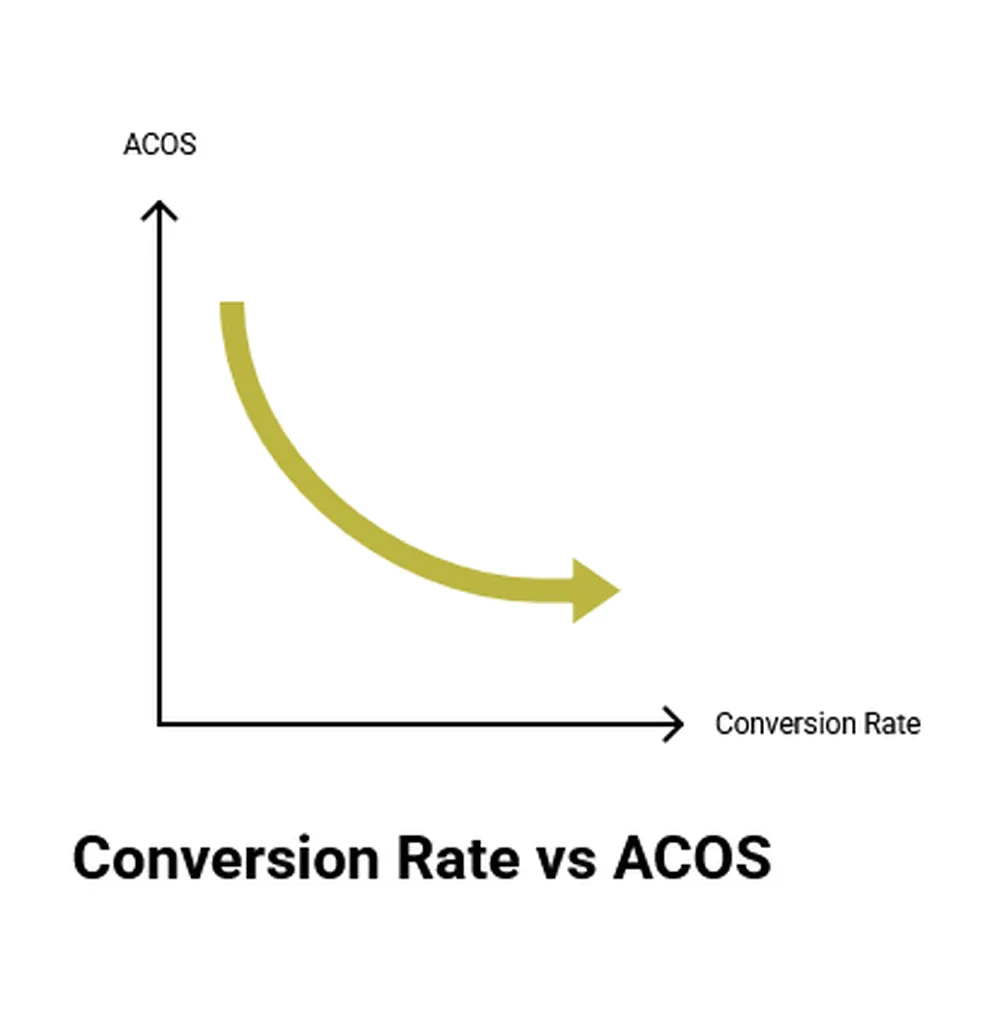
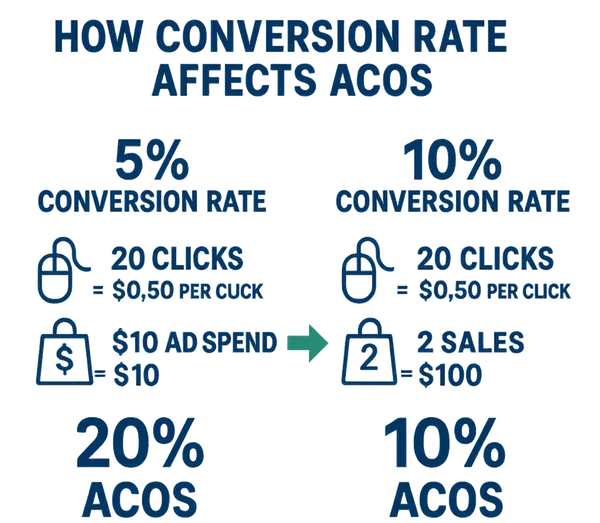
Your Advertising Cost of Sale (ACOS) decreases as your conversion rate increases. ACOS measures how much you spend on advertising relative to the sales you generate. With a higher conversion rate, you get more sales from the same number of clicks, which means your ad spend generates more revenue. For example, if your conversion rate doubles from 5% to 10%, you would get twice as many sales for the same ad spend, effectively cutting your ACOS in half.
Return on Ad Spend (ROAS) improves proportionally with conversion rate increases. ROAS is the inverse of ACOS—it tells you how many dollars in sales you generate for each dollar spent on advertising. When more of your ad clicks convert to sales, your ROAS naturally increases. A product with a 5% conversion rate might have a ROAS of 2.5, while the same product with a 10% conversion rate could achieve a ROAS of 5.0, making your advertising twice as profitable.
Better conversion rates also lead to improved ad placement. Amazon’s algorithm favors products that convert well because they generate more revenue for Amazon. When your ads convert better than competitors’, Amazon rewards you with better ad positions and more impressions, often at lower costs per click. This creates a positive feedback loop: better conversion rates lead to better placement, which brings more targeted traffic, potentially leading to even more conversions.
A real-world example shows how powerful this effect can be. One seller improved their product images and optimized bullet points, increasing their conversion rate from 12% to 15%. This modest 3% improvement reduced their ACOS from 32% to 24%—a 25% reduction in advertising costs relative to sales. Their ads began appearing in better positions, further increasing their visibility and sales volume.
How Amazon’s Algorithm Uses Conversion Rate
Amazon’s algorithm considers conversion rates critically when determining both your organic rankings and paid ad placements. Understanding this relationship helps you see why improving conversion rates is one of the most powerful strategies for Amazon success.
Amazon’s A9/A10 algorithm prioritizes products that convert well because these products make more money for Amazon. The platform wants to show products that customers are likely to buy, not just products they’ll click on. When your listings convert at a higher rate than competitors, Amazon’s algorithm recognizes this as a signal that customers prefer your product. As a result, your organic ranking improves, bringing more free traffic to your listings.
For PPC campaigns, conversion rate influences how Amazon’s advertising algorithm treats your ads. A higher conversion rate signals to Amazon that your ad is relevant to the search terms you’re bidding on. Amazon then rewards your ads with better placements and sometimes lower cost-per-click rates. This improves your advertising efficiency and helps you win more ad auctions, even without increasing your bids.
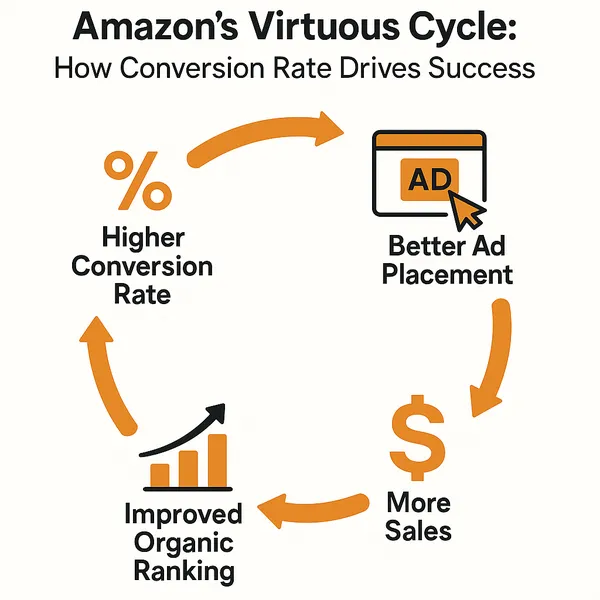
This creates a powerful feedback loop between your conversion rate and keyword ranking. As your ads convert better, you win more prominent ad placements. These better placements bring more sales, which improve your organic ranking factors. As your organic ranking improves, your products gain credibility, which can further increase conversion rates. This virtuous cycle compounds over time, creating a sustainable competitive advantage.
The relationship works in both directions. Products with poor conversion rates enter a negative spiral: poor conversions lead to worse ad placement and higher costs, which reduce profitability, limiting how much you can spend on advertising. Over time, products with low conversion rates become increasingly difficult to advertise profitably on Amazon.
To leverage this algorithmic relationship, focus first on improving your conversion rate before scaling up your ad spend. A product with a strong conversion rate can maintain profitability even with aggressive advertising, while a poorly converting product will drain your budget regardless of how carefully you manage your campaigns.
Benchmarking: What’s a Good Conversion Rate for Amazon PPC?
Understanding where your conversion rates stand compared to industry averages helps you set realistic goals and identify improvement opportunities. Amazon conversion rates typically exceed those of other e-commerce platforms because Amazon visitors often have higher purchase intent.
The average conversion rate for Amazon PPC campaigns ranges between 10% and 15%. This means for every 100 people who click on your ad, about 10-15 make a purchase. However, these numbers vary significantly depending on multiple factors specific to your business and products.
Product pricing dramatically affects expected conversion rates. Lower-priced items (under £25) typically convert at higher rates, often 15-20%, because they require less consideration from buyers. Mid-priced products (£25-£100) usually see conversion rates around 10-15%. Premium products priced over £100 might have healthy conversion rates of just 5-10%, as customers research more thoroughly before making larger purchases.
Competition within your category also impacts conversion benchmarks. Highly competitive categories like phone cases or vitamins might have lower average conversion rates because customers compare many options before buying. Niche products with less competition often enjoy higher conversion rates because shoppers have fewer alternatives to consider.
Seasonal factors create significant conversion rate fluctuations throughout the year. During major shopping events like Prime Day or Black Friday, conversion rates often increase by 30-50% above baseline as motivated buyers with high purchase intent browse Amazon. Conversely, certain products see seasonality effects that reduce conversion rates during off-seasons.
When benchmarking your performance, compare your conversion rates to similar products in your category and price range rather than to overall Amazon averages. A 7% conversion rate might be excellent for a high-ticket item in a competitive category, while 12% could be underperforming for an inexpensive product in a less competitive space.
Set realistic improvement goals based on your starting point. If your current conversion rate is 8%, aiming for a 2-3 percentage point improvement (to 10-11%) represents a significant achievement that could substantially improve your PPC profitability. Dramatic increases beyond 5 percentage points are rare without major product or listing changes.
The 7 Critical Factors Affecting Amazon PPC Conversion Rates
Several key factors determine whether visitors who click your ads become buyers. Understanding these elements helps you identify where to focus your optimization efforts for maximum impact on your conversion rates.
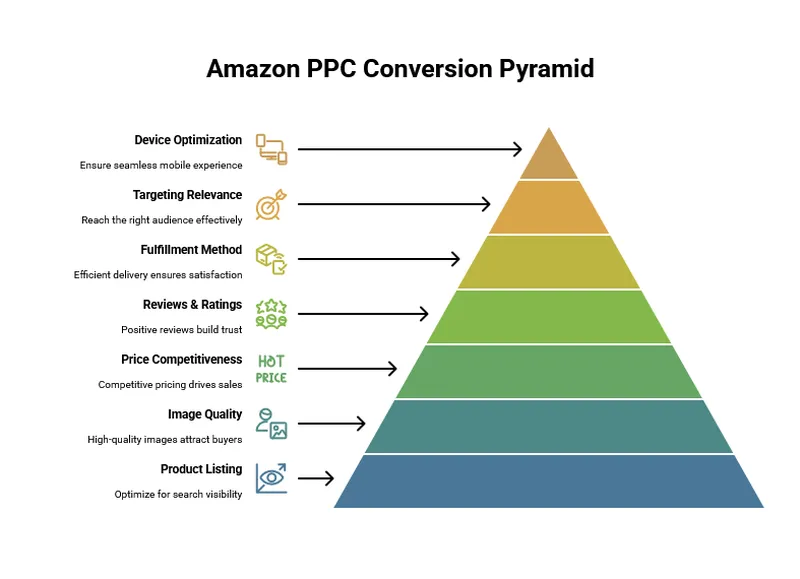
Your product listing optimization fundamentally drives conversion. The title, bullet points, and description work together to convince shoppers your product meets their needs. Titles should include your main keywords while clearly describing what the product is. Bullet points must highlight the key benefits and features customers care about most. Descriptions should address potential concerns and provide additional information that helps shoppers make a decision. Poorly written listings with keyword stuffing, grammatical errors, or confusing descriptions significantly reduce conversion rates.
Image quality and quantity play a crucial role in conversion rates. Amazon allows up to nine images, and using all available slots generally improves conversion rates. Your main image must show the product clearly against a white background, while secondary images should display different angles, size reference, and the product in use. High-resolution, professional-quality photos that accurately represent your product build trust. Blurry, misleading, or insufficient images drive potential customers away, often reducing conversion rates by 30% or more compared to listings with excellent imagery.
Price competitiveness directly impacts conversion rates. Shoppers on Amazon frequently compare prices, and being significantly more expensive than similar products without a clear reason hurts conversion. You don’t need to be the cheapest option, but your price should align with the perceived value of your product. Products priced 10-15% higher than competitors may still convert well if you clearly communicate their superior quality or additional features.
Reviews and ratings serve as powerful social proof. Products with more positive reviews typically convert at higher rates because they reduce the perceived risk of purchase. The quality, recency, and relevance of reviews matter as much as the overall rating. Responsive seller interaction with reviews, especially addressing negative feedback, can mitigate conversion impacts of less-than-perfect ratings by showing you care about customer satisfaction.
Fulfillment method significantly affects buyer confidence. Products fulfilled by Amazon (FBA) typically convert at 30-50% higher rates than merchant-fulfilled items because customers trust Amazon’s delivery reliability and customer service. FBA products also qualify for Prime shipping, which itself can boost conversion rates by making your product more attractive to Amazon’s most active customer base.
Targeting relevance in PPC campaigns directly influences conversion rates. Ads appearing for highly relevant search terms bring in shoppers with specific purchase intent, while broad match or loosely related keywords may generate clicks from browsers who aren’t ready to buy. Refining your targeting to focus on the most relevant, high-converting keywords improves both your conversion rate and advertising efficiency.
Device optimization matters increasingly as more shoppers use mobile devices. On mobile, customers see different elements of your listing in a different order, with images and the buy box appearing before detailed descriptions. Ensuring your listing looks compelling on both desktop and mobile interfaces is essential for maximizing conversion rates across all traffic sources.
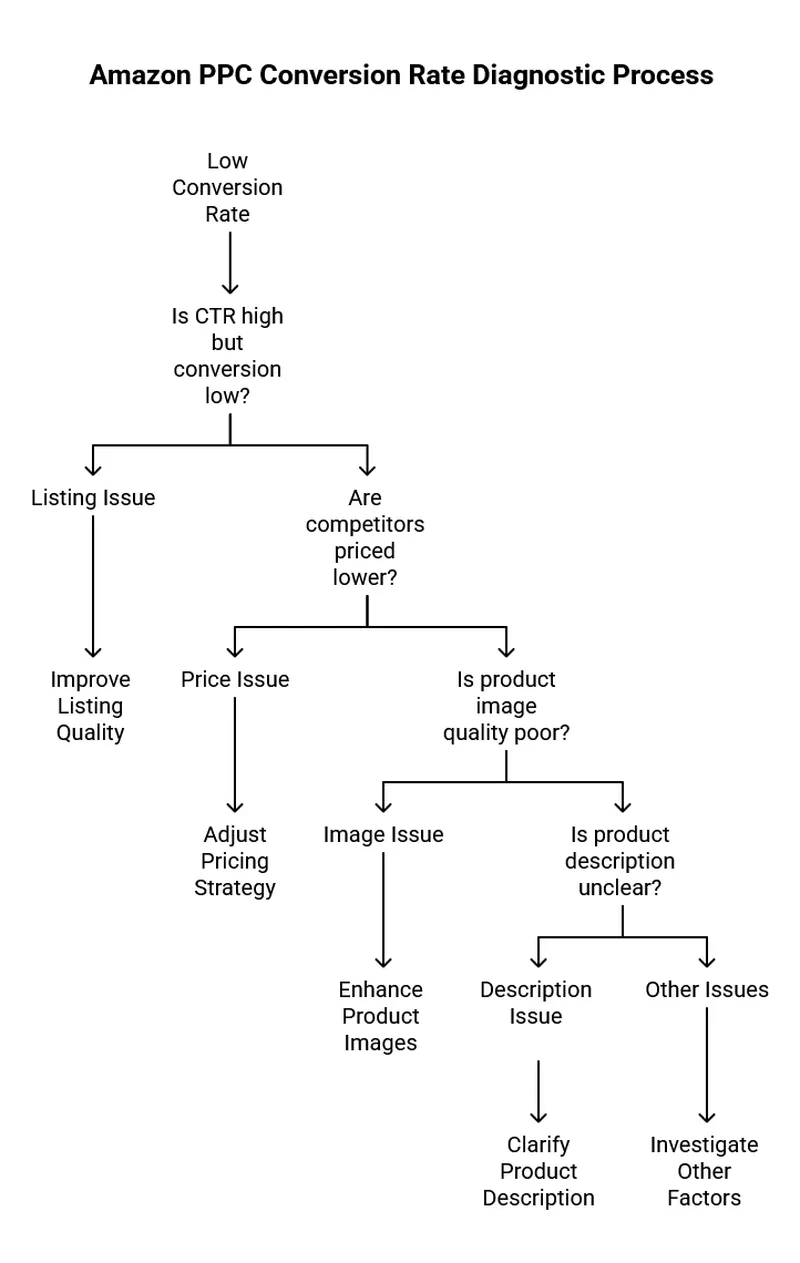
Conversion Rate Diagnostic: Identifying Why Your PPC Isn’t Converting
When your Amazon PPC campaigns show poor conversion rates, systematic diagnosis helps identify the specific issues holding back your performance. This process involves examining several metrics and analyzing different aspects of your product listings and campaigns.
Start by analyzing your basic PPC metrics to identify patterns. Compare conversion rates across different match types, campaigns, and ad groups. If broad match keywords convert poorly while exact match performs well, your targeting may be too broad, bringing in unqualified traffic. If all match types show low conversion, the issue likely lies with the product listing itself. Also examine your click-through rate (CTR)—if it’s high but conversion is low, people like your ad but are disappointed by what they find after clicking.
Examine session behavior metrics in your Amazon reports to understand how visitors interact with your listing. Look at the average time spent on page—if it’s very short (under 20 seconds), visitors might not be finding what they’re looking for quickly enough. Pay attention to the number of images viewed per session; more image views typically indicate higher engagement and interest. The percentage of visitors who view the “Frequently Bought Together” section can indicate if customers are comparison shopping or considering additional items.
Common conversion killers include price misalignment, which occurs when your price is significantly higher than competitors without clear differentiation. Another frequent issue is review discrepancies, where competitors have more or better reviews, causing customers to choose them instead. Feature mismatches happen when customers expect certain features based on your ad but don’t find them clearly stated in your listing. Inventory problems, including frequently being out of stock or having long delivery times, also severely impact conversion rates.
Several tools can help diagnose conversion issues. Amazon’s Brand Analytics provides valuable insights into search terms and competitor performance if you’re a brand-registered seller. The Search Term Report in your advertising console shows exactly which customer searches led to clicks and conversions. Listing quality assessment tools like Helium 10’s Listing Analyzer or Jungle Scout’s Listing Grader can identify specific weaknesses in your listings compared to top performers.
Competitor analysis provides crucial context for your conversion problems. Study the listings of similar products with better seller ranks, as they likely convert better than yours. Compare your images, bullet points, and overall messaging to identify what they’re doing differently. Sometimes small details like including size charts, clearer warranty information, or better usage instructions make a significant difference in customer confidence and conversion rates.
Once you’ve identified potential issues, prioritize them based on impact and ease of fixing. Some problems, like improving images or rewriting bullet points, can be addressed quickly. Others, like building more reviews or changing your fulfillment method, take longer but may have greater long-term impact. Focus first on the issues most likely to be hurting your conversion rates based on your diagnostic findings.
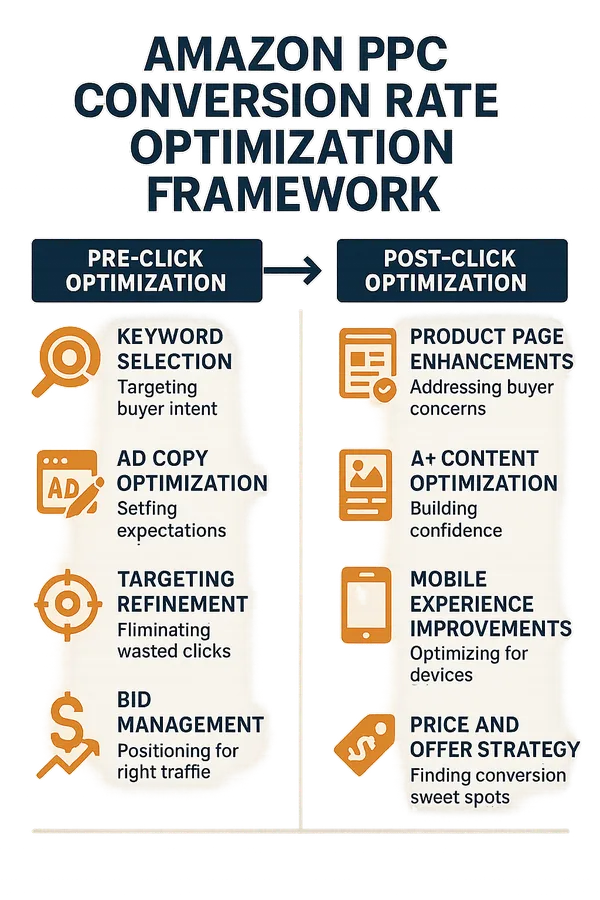
The Comprehensive Conversion Rate Optimization Framework for PPC
Improving your Amazon PPC conversion rates requires addressing both what happens before customers click (pre-click) and after they land on your listing (post-click). This comprehensive framework helps you optimize the entire customer journey for maximum conversions.
Pre-click optimization focuses on attracting the right visitors to your listing through your PPC campaigns. Start with keyword selection targeting buyer intent. Focus on specific, product-oriented search terms rather than broad informational queries. For example, “waterproof bluetooth speaker with bass” shows higher buying intent than “bluetooth speakers.” Keywords indicating purchase readiness like “best,” “top rated,” or specific model numbers typically convert better than general terms. Refine your keyword lists based on performance data, prioritizing terms with higher conversion rates.
Your ad copy plays a crucial role in setting accurate expectations. Craft compelling but honest sponsored brand headlines and product titles that highlight your most important selling points. Including specific benefits or features that differentiate your product helps pre-qualify clicks. For example, “Waterproof Bluetooth Speaker - 24 Hour Battery Life” sets expectations about key features. Match your ad messaging with your listing’s main selling points to ensure consistency between what customers expect and what they find after clicking.
Targeting refinement involves eliminating wasted clicks from unlikely buyers. Use negative keywords to exclude irrelevant traffic, such as terms related to competing products or features you don’t offer. Adjust your device targeting if your conversion data shows significant differences between mobile and desktop performance. Consider dayparting (scheduling ads during high-conversion times) if your data reveals temporal patterns in buying behavior.
Post-click optimization focuses on converting visitors once they reach your listing. Product page enhancements should address the key questions and concerns buyers have. Ensure your listing communicates all critical information in the first screen without requiring scrolling. Make your product’s unique selling proposition immediately obvious. Your bullet points should follow a benefit-first approach, explaining how features improve the customer’s life rather than just listing specifications. Incorporate frequently asked questions directly into your listing content to preemptively address concerns.
A+ content optimization provides additional conversion leverage for brand-registered sellers. Use comparison charts to showcase your advantages over alternatives. Include lifestyle images showing your product in use to help customers envision owning it. Incorporate customer testimonials or use cases within your enhanced content. Focus on solving customer problems rather than just highlighting product features. Well-designed A+ content can increase conversion rates by 3-10% by building confidence and addressing hesitations buyers might have.
Mobile experience improvements are increasingly important as mobile shopping grows. Test your listing on smartphones to identify readability issues or elements that don’t display well. Ensure your most compelling images and information appear before the “fold” on mobile screens. Make key product details visible without requiring extensive scrolling or expanding sections. Consider that mobile shoppers often make quicker decisions, so frontload your most persuasive content.
Price and offer optimization can dramatically impact conversion rates. Test different price points to find your conversion sweet spot. Consider temporary promotions or coupons to increase conversion during new product launches or competitive periods. For products where price sensitivity is high, experiment with quantity discounts or bundles to improve perceived value. Monitor competitive pricing regularly and adjust your strategy to maintain an optimal position for conversion.
Advanced Strategies: A/B Testing for Amazon Conversion Optimization
A/B testing provides a systematic approach to improving your Amazon conversion rates by comparing different versions of your listing elements to see which performs better. This data-driven methodology removes guesswork and leads to continual improvement in your conversion rates.
Focus your initial testing efforts on elements with the highest potential impact. Main product images typically influence conversion rates more than any other element, making them ideal for first tests. Titles are the second most important element, directly affecting click-through rates and setting customer expectations. Pricing tests often yield significant insights, as small price adjustments can dramatically shift conversion patterns. Bullet points, especially the first two that appear without expanding the section, are also high-impact testing candidates. Start with these elements before moving to less influential factors like product descriptions or secondary images.
Setting up proper A/B tests requires methodical planning. First, establish a clear baseline by measuring your current conversion rate over a sufficient time period—typically at least two weeks of data. Identify a single element to change while keeping all other listing elements identical to isolate the variable being tested. Make substantive but focused changes, such as trying a completely different main image angle or a restructured title that emphasizes different benefits. Create a testing schedule that allows each variation to run for at least 7-14 days to account for weekly sales patterns.
Amazon doesn’t offer native A/B testing tools for most sellers, but several approaches work effectively. The simplest method involves making a single change to your listing and comparing before-and-after conversion rates, accounting for any seasonality or other external factors. More sophisticated sellers use periodic rotation, alternating between two versions on a regular schedule and tracking performance of each. Brand-registered sellers can access Amazon’s Manage Your Experiments tool, which provides true split testing for A+ content, though not for all listing elements.
Interpreting test results requires both statistical understanding and business context. Look for statistically significant differences—generally requiring hundreds of sessions per variation to be meaningful. Consider confidence intervals rather than focusing solely on absolute numbers. A 20% lift in conversion rate with high statistical confidence provides a clear winner, while smaller differences might require longer testing periods. Also consider secondary metrics beyond conversion rate, such as changes in average order value or review rates, which affect long-term profitability.
Implementing test results effectively means creating a continuous optimization cycle. Document all tests and results to build institutional knowledge about what works for your specific products and customers. Apply successful elements across similar products in your catalog, while recognizing that what works for one product may not work for all. Establish a regular testing calendar that prioritizes high-impact elements and systematically works through your listing components. After implementing changes, monitor performance to ensure sustained improvement, as market conditions and customer preferences evolve over time.
Advanced sellers combine elements from multiple successful tests to compound improvements. For example, if a new main image improves conversion by 5% and restructured bullet points add another 3%, implementing both might yield a combined improvement greater than the sum of individual changes. This compounding effect makes systematic testing one of the most powerful approaches to long-term conversion rate optimization.
The Seasonality Factor: Adjusting for Conversion Rate Fluctuations
Conversion rates naturally fluctuate throughout the year due to seasonal shopping patterns, which significantly impacts your Amazon PPC strategy. Understanding and preparing for these changes helps you maintain profitable advertising year-round.
Most product categories experience predictable conversion rate patterns during the year. The fourth quarter, particularly the period between Black Friday and Christmas, typically shows dramatically higher conversion rates across almost all categories. During this high-intent shopping season, conversion rates might increase 30-50% above your yearly average. Summer months often see lower conversion rates for indoor or winter-focused products but higher rates for seasonal items like outdoor gear or swimming accessories. January typically brings a post-holiday slump in conversion rates as consumer spending decreases after December’s peak.
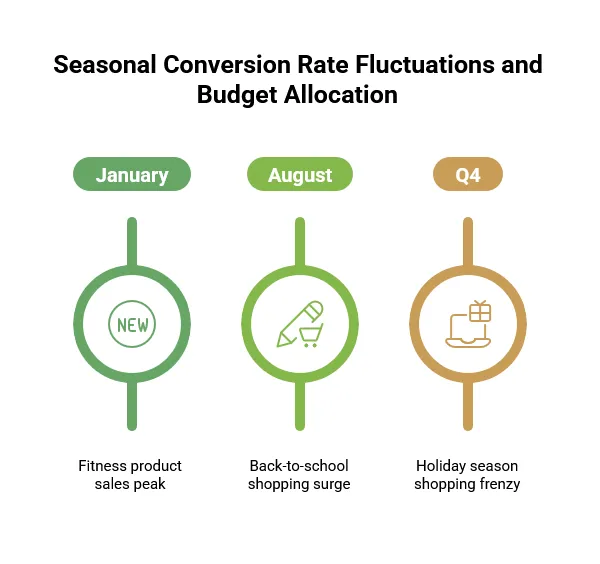
Category-specific seasonality creates additional patterns. Fitness products see conversion spikes in January (New Year’s resolutions) and before summer. School and office supplies convert better during back-to-school periods in August and September. Gift-oriented items experience mini-conversion boosts around Mother’s Day, Father’s Day, and Valentine’s Day. Identifying these patterns for your specific category helps you anticipate conversion changes and adjust your PPC strategy accordingly.
Seasonal PPC strategy adjustments should align with these expected conversion fluctuations. During high-conversion periods, increase your advertising budgets and bids to capture additional traffic when your ROAS is likely to be strongest. You can afford to be more aggressive because each click has a higher probability of converting to a sale. Conversely, during known low-conversion periods, reduce ad spend and focus on your most efficient keywords to maintain profitability despite lower conversion rates.
Adjust your expected performance metrics seasonally rather than using the same targets year-round. During peak season, you might aim for a lower ACOS than your annual average, taking advantage of higher conversion efficiency. During slow periods, you may need to accept a temporarily higher ACOS to maintain visibility and sales velocity. Setting realistic, season-adjusted targets prevents both missed opportunities during high-conversion periods and wasteful spending during low-conversion times.
Budget allocation based on conversion potential maximizes your annual advertising efficiency. Analyze your historical data to identify which months have the highest conversion rates for your products. Allocate a larger portion of your annual advertising budget to these high-performing periods. For example, if your conversion rates in November and December are double your annual average, you might allocate 30-40% of your yearly PPC budget to these two months alone. This approach ensures you’re investing most heavily when your advertising dollars convert most efficiently.
Prepare for seasonal transitions by gradually adjusting your bids and budgets rather than making dramatic overnight changes. Begin increasing budgets 2-3 weeks before an expected conversion uptick to establish good placement and campaign history. Similarly, start tapering spend gradually as you approach known lower-conversion periods. This smooth transition approach maintains campaign momentum and prevents algorithmic disruptions that can occur with sudden, large changes to your advertising parameters.
Case Studies: Conversion Rate Success Stories
Real-world examples illustrate how Amazon sellers have successfully improved their conversion rates and transformed their PPC performance. These case studies provide practical insights you can apply to your own products.
A small hobby shop selling specialized craft supplies struggled with a 7% conversion rate despite having a unique product. After analyzing their listing, they identified poor image quality as their main conversion barrier. They invested £300 in professional product photography, increasing their images from three basic photos to eight high-quality images showing the product from multiple angles, in use, and with size reference objects. This change increased their conversion rate to 12.5% within three weeks—a 78% improvement. Their PPC campaigns, which previously operated at a 45% ACOS, dropped to 26% ACOS without any changes to bids or keywords. The photography investment paid for itself within the first month through improved advertising efficiency.
A mid-size brand selling premium kitchenware faced conversion rates of only 9% despite strong reviews and competitive pricing. Their diagnostic process revealed that customers were confused about product dimensions and material quality, as evidenced by questions and reviews. They completely rebuilt their listing with a focus on clarity and customer concerns. Their new listing featured a comparison chart in the image stack showing size relative to common objects, added specific material information to the title and first bullet point, and created an FAQ section addressing the top customer questions. These changes boosted their conversion rate to 18%—doubling their previous performance. The improved conversion rate allowed them to bid more aggressively on competitive keywords, increasing their visibility while maintaining profitable advertising.
An enterprise seller with a catalog of over 100 fitness products implemented systematic conversion rate optimization across their entire product line. They developed a testing framework examining one element per week, starting with main images, then titles, bullet points, and A+ content. By documenting each test result and applying successful patterns across similar products, they improved their average conversion rate from 10.5% to 14.2% over six months. This 35% conversion improvement reduced their catalog-wide ACOS from 32% to 22%, saving over £45,000 monthly in advertising costs while maintaining the same sales volume. The most significant finding from their testing was that benefit-focused bullet points converted substantially better than specification-focused ones across almost every product category.
The key lessons from these case studies reveal common success patterns. First, objective diagnosis using data rather than assumptions helped identify the actual conversion barriers rather than perceived ones. Second, investment in high-impact elements like images and clear communication of product benefits delivered the greatest returns. Third, methodical testing and implementation created compound improvements that were significantly larger than any single change could achieve. Finally, improved conversion rates enabled more aggressive advertising strategies, creating a virtuous cycle of better placement leading to more sales.
These examples demonstrate that conversion rate optimization is not just about incremental improvements—substantial gains of 50% or more are possible with the right approach. Even well-established products with seemingly good conversion rates often have significant improvement potential that directly translates to bottom-line profit through more efficient advertising.
Common Misconceptions About Amazon PPC Conversion Rates
Several persistent myths about Amazon PPC conversion rates lead sellers to make counterproductive decisions. Understanding these misconceptions helps you avoid common pitfalls and focus on strategies that actually improve your results.
Many sellers believe a high conversion rate should be the ultimate goal of their Amazon business, sometimes pursuing it at the expense of other metrics. This overlooks the critical relationship between conversion rate and profitability. A 25% conversion rate achieved by drastically cutting prices might look impressive but could destroy your profit margins. Similarly, limiting your advertising to only the highest-converting but lowest-volume keywords might boost your conversion percentage while significantly reducing total sales. Instead of maximizing conversion rate in isolation, focus on optimizing your conversion rate within a profitable price range and appropriate traffic volume.
Another common misconception is that conversion rates are the only measure of PPC success. While conversion rate is important, it’s just one component of a healthy Amazon business. Other critical metrics include total order volume, average order value, customer retention rate, and overall profitability. A campaign with a slightly lower conversion rate but higher average order value or better customer retention might be more valuable to your business long-term. Take a holistic view that considers how conversion rate works together with other performance indicators rather than optimizing it in isolation.
Many sellers mistakenly believe that a good conversion rate is the same for every product and category. This leads to inappropriate comparisons and unrealistic goals. A 7% conversion rate might be excellent for a high-ticket item like furniture but poor for an inexpensive consumer packaged good. Seasonal products naturally experience substantial conversion rate fluctuations throughout the year. Products targeting niche audiences often convert better than those in broad categories due to more specific customer intent. Set appropriate benchmarks by comparing your conversion rate to similar products in your category and price range rather than to arbitrary standards.
Some sellers believe that Amazon PPC conversion rates are completely separated from organic conversion rates, missing the interconnected nature of your listing performance. In reality, improvements to your listing that boost PPC conversion rates almost always improve organic conversion rates as well, and vice versa. The same customers see your product whether they arrive through ads or organic search, and they respond to the same quality signals. This misconception sometimes leads to the wasteful practice of creating separate strategies for PPC and organic optimization when a unified approach would be more effective.
A particularly harmful myth is that conversion rate optimization requires expensive tools or specialized expertise. While advanced tools can help, many of the most impactful conversion improvements come from basic listing elements: better images, clearer titles, more compelling bullet points, and competitive pricing. These fundamentals often yield greater conversion improvements than complex technical optimizations. Start with these core elements before investing in specialized tools or consultants.
Finally, some sellers believe conversion optimization is a one-time project rather than an ongoing process. Customer preferences evolve, competitors update their listings, and Amazon’s algorithm changes over time. What converts well today might perform poorly next year. Successful sellers treat conversion rate optimization as a continuous process, regularly testing new approaches and refining their listings to maintain competitive performance.
Measuring Success: Tracking Your Conversion Rate Improvements
Effective conversion rate optimization requires proper measurement to understand what’s working and quantify your progress. Setting up comprehensive tracking systems helps you make data-driven decisions and demonstrate the ROI of your optimization efforts.
Essential tools and reports form the foundation of your measurement system. Amazon’s Advertising Console provides basic conversion metrics including advertising conversion rate, ACOS, and sales per click. Business Reports in Seller Central offer broader metrics like overall conversion rate (called “Unit Session Percentage”) and total sales data. For brand-registered sellers, Brand Analytics provides valuable competitive insights and search term performance data.
Create a conversion rate dashboard to centralize your key metrics for easy monitoring. Your dashboard should include both overall and PPC-specific conversion rates, showing trends over time rather than just current values. Include related metrics that help tell the complete story, such as click-through rates, average order value, and total revenue. Segment your data by product categories, campaigns, and placement types to identify patterns and opportunities. Update your dashboard regularly—weekly for active campaigns and at least monthly for your overall account health review.
Setting up alerts and notifications helps you respond quickly to significant changes. Configure automated alerts for sudden drops in conversion rate (over 20% from your baseline) that might indicate listing problems or competitive changes requiring immediate attention. Create regular performance report notifications for weekly monitoring to spot and address issues quickly.
Mastering Your Amazon PPC: The Crucial Role of Conversion Rate
Ultimately, grasping why conversion rate is so important for Amazon PPC isn’t just academic—it’s the bedrock of profitable advertising on the platform. As we’ve explored, your conversion rate directly dictates the efficiency of your ad spend, influencing everything from your Advertising Cost of Sale (ACOS) and Return on Ad Spend (ROAS) to your ad placement and even your organic search rankings via Amazon’s algorithm.
By systematically optimizing your product listings, refining your ad targeting, A/B testing key elements, and understanding seasonal fluctuations, you’re not just aiming for a higher percentage; you’re building a more resilient and profitable Amazon PPC strategy. This journey from diagnosing issues to implementing a comprehensive optimization framework is crucial.
The importance of conversion rate for Amazon PPC lies in its power to create a virtuous cycle: better conversions lead to improved ad performance, which enhances visibility and sales, further fueling your success on Amazon. Embrace the strategies outlined, monitor your progress diligently, and watch as optimizing your conversion rate transforms your PPC campaigns from a potential cost center into a powerful growth engine for your Amazon business.