Stop Wasting Money on Amazon Keyword Research (Forensic Profit Protocol)
Table of Contents
You just reviewed your monthly Amazon ad spend and discovered you’re burning $2,000 per month at 45% Advertising Cost of Sales on campaigns that seemed profitable last quarter. Your keyword research tool gave you 300 high-volume keyword suggestions, but you have no idea which ones are making money and which are bleeding your budget dry. You tried negating some expensive search terms, but sales dropped 30% overnight. The tools show data, but they don’t tell you what to actually do.
Most Amazon sellers spend hours finding keywords using Helium 10, Jungle Scout, or free autocomplete tools. They add broad match keywords, celebrate when Advertising Cost of Sales drops from 40% to 25%, and follow blog advice to optimize regularly. But here’s what the tool blogs don’t tell you: reducing Advertising Cost of Sales is a terrible goal. You can reduce Advertising Cost of Sales to 0% by turning off all ads. The real question is whether your total profit increased or decreased.
Meanwhile, Amazon’s matching behavior is working against you in ways you cannot see. When you negate box of sweets in exact match (trying to stop one unprofitable search term), Amazon also blocks box sweets, sweets box, box for sweets, and 12 other profitable variations because it ignores stop words. You just accidentally killed $800 in monthly profit trying to save $50.
This article will first show you how to find keywords (satisfying the basic question), then reveal the expert framework for identifying which search terms are actually profitable. You’ll learn how to optimize at the correct granularity level, when to fix your listing versus when to negate a search term, and why most sellers optimize the wrong metrics. You’ll calculate your actual break-even point based on your specific product margins.
How to Find Keywords for Amazon (The Basic Process)
Finding keywords for Amazon products requires using both Amazon’s native tools and third-party software. Amazon provides Product Opportunity Explorer, Search Query Performance Dashboard, and Search Term Report directly in Seller Central. These tools show actual customer search queries and trending terms. Third-party options range from free tools like Sonar to paid platforms like Helium 10 and Jungle Scout.
Amazon Native Tools (Free)
Product Opportunity Explorer is Amazon’s native keyword research tool in Seller Central. It provides search volume data, click share percentages, and conversion share metrics for trending search terms. Access it through the Growth menu in Seller Central. The tool shows what customers are searching for but provides no profitability insight for your specific product.
Search Query Performance Dashboard displays search query metrics including impressions and click-through rates. It helps identify which search terms customers use to find products in your category. The data is aggregated across all sellers, not specific to your campaigns.
Search Term Report is the most valuable free data source for active advertisers. It shows actual customer search queries that triggered your ads, along with performance metrics. Download it from Campaign Manager under Reports. This report is only available for automatic campaigns or after search terms generate traffic in your manual campaigns.
Amazon Autocomplete provides keyword suggestions when you type into the Amazon search bar. Type your main product descriptor and record the suggestions that appear. This method is fast but incomplete because it only shows popular variations Amazon chooses to display.
Competitor ASIN reverse lookup involves viewing competitor product listings and noting keywords in their titles and bullet points. This method is limited to visible keywords only and misses backend search terms competitors may be using.
Third-Party Paid Tools
Helium 10 offers Magnet for seed keyword research and Cerebro for competitor ASIN analysis. Pricing starts at $99 per month. The platform supports 14 different Amazon marketplaces and provides estimated search volume, keyword difficulty scores, and historical trend data.
Jungle Scout provides keyword research capabilities with estimated search volume and competitor tracking. Pricing tiers start around $99 per month. The tool uses autocomplete data to generate keyword suggestions.
Viral Launch and AMZScout offer similar features including search volume estimates and keyword tracking. Both platforms use autocomplete-based data rather than actual Amazon search data.
Most third-party tools estimate search volume using autocomplete data. Ahrefs claims to use real-user browsing data instead of autocomplete, potentially providing more accurate volume estimates. Treat all volume numbers as directional guidance, not absolute truth. The accuracy varies significantly between tools.
Free Third-Party Options
Sonar by Sellics is the most comprehensive free keyword research tool. It provides keyword suggestions with estimated search volumes at no cost. The free version has limitations on daily searches.
Keyword Tool Dominator offers a limited free version with basic autocomplete scraping. Paid lifetime access starts at $98 one-time payment.
Google Keyword Planner provides a partial proxy for Amazon search intent. Many product searches begin on Google, making this data somewhat relevant. However, Google intent differs from Amazon intent (informational versus transactional).
Manual competitor analysis costs nothing but time. Review top-ranking competitor listings in your category and compile keywords from their titles, bullets, and product descriptions.
Short-tail vs Long-tail Keywords
Short-tail Keywords are 1-2 word phrases like shoes or laptop. These terms have higher search volume but also higher competition. Conversion Rate is typically lower because the search intent is less specific. A customer searching laptop could want gaming laptops, business laptops, or budget laptops.
Long-tail Keywords are 3+ word phrases like comfortable running shoes for kids or lightweight laptop for college students. Individual long-tail terms have lower search volume but collectively drive significant traffic. Competition is lower and Conversion Rate is higher because the search intent is more specific. The customer already knows exactly what they want.
Strategic balance requires using both types. Long-tail keywords are often more profitable for new sellers because you can rank more easily and convert at higher rates. Short-tail keywords provide volume once you’ve built ranking momentum and reviews.
Basic Keyword Research Process (Step-by-Step)
Start with seed keywords representing your main product descriptors. For a stainless steel water bottle, seed keywords include water bottle, insulated bottle, metal bottle.
Expand using Amazon autocomplete and competitor analysis. Type each seed keyword into the Amazon search bar and record autocomplete suggestions. Visit the top 5 competitor listings and extract keywords from their titles and bullets.
Run seed keywords through keyword research tools (free or paid) to find variations. Tools will suggest related terms, common misspellings, and synonym variations you might miss manually.
Check Product Opportunity Explorer for trend confirmation. If your tools suggest emerging keywords, verify whether Amazon data shows increasing search volume for those terms.
Organize keywords by search intent. Group informational keywords (how to clean water bottle) separately from transactional keywords (buy insulated water bottle). Focus your ad campaigns on transactional intent.
Add keywords to campaigns using appropriate match types. Broad Match shows your ad for close variations and synonyms. Phrase Match requires the keyword phrase in order but allows additional words. Exact Match is the most restrictive but still not truly exact (more on this later).
Monitor Search Term Report for actual performance data. After 30 days of running campaigns, download the Search Term Report to see which actual customer searches triggered your ads and drove sales.
Now you have a list of 50-200 keywords. Most content stops here. But finding keywords is only 20% of the work. The critical 80% is identifying which search terms are making you money versus which are burning your budget - and this is where most Amazon sellers go catastrophically wrong.
Why Most Keyword Research Fails (The Profitability Gap)
The Tools Show Volume, Not Profit
Search volume does not equal profitability. High-volume keywords often have low conversion rates because the search intent is too broad. A customer searching laptop might be researching, comparing prices, or looking for repair services. A customer searching lightweight laptop for college students under 500 has clear purchase intent.
Consider this comparison: laptop gets 100,000 searches monthly. Lightweight laptop for college students under 500 gets 800 searches monthly. The first has 10x volume. The second has 3x Conversion Rate. Which drives more sales?
Keyword research tools cannot account for YOUR product’s Conversion Rate on specific search terms. They show aggregate market data but your listing quality, pricing, and reviews determine whether clicks convert to sales. A high-volume keyword is worthless if your product doesn’t match what searchers expect.
The Advertising Cost of Sales Trap (Case Study)
A seller celebrates reducing Advertising Cost of Sales from 35% to 22% over 3 months. They followed all blog advice: paused high Advertising Cost of Sales keywords, optimized bids, tightened targeting. The Advertising Cost of Sales dashboard looks great.
The total profit calculation reveals the problem. Before optimization: $10,000 ad spend, $28,571 ad sales, 35% Advertising Cost of Sales. With a 30% margin product, this generated $8,571 profit. After optimization: $6,000 ad spend, $27,273 ad sales, 22% Advertising Cost of Sales. This generated $8,182 profit.
Advertising Cost of Sales improved, but total profit dropped $389. Organic sales also dropped 15% because reduced advertising created a negative halo effect. The seller optimized for the wrong metric and lost money while celebrating improvement.
The lesson is clear: Advertising Cost of Sales reduction is not the goal. Total profit is the goal.
Match Type Mythology
Most sellers think exact match means exact. Amazon’s actual matching behavior is different and creates dangerous optimization traps.
Amazon ignores stop words in matching. Stop words include of, by, for, with, and, the. When you add box of sweets as an exact match keyword, Amazon treats it identically to box sweets, boxes sweet, sweet box, sweets boxes, box for sweets, and 10+ other variations.
Amazon treats singular and plural as identical. Wireless earbud and wireless earbuds pool impressions and compete for the same ad placements. You cannot target one without targeting the other.
This matters critically for negative matching. When you negate box of sweets in exact match (trying to stop one unprofitable search term), Amazon blocks box sweets, sweets box, box for sweets, box and sweets, box with sweets, and dozens of other variations. You may accidentally kill profitable search terms while eliminating one bad one.
The Keyword Level Optimization Mistake
Common advice says pause keywords with Advertising Cost of Sales above 30%. This is dangerous with broad or phrase match campaigns.
Your broad match keyword wireless earbuds might trigger 50 different search terms. Ten search terms run at 15% Advertising Cost of Sales (profitable). Thirty-five search terms run at 28% Advertising Cost of Sales (profitable). Five search terms run at 80% Advertising Cost of Sales (unprofitable).
The aggregate keyword Advertising Cost of Sales calculates to 32%. If you pause the keyword because it exceeds your 30% target, you kill 45 profitable search terms to stop 5 unprofitable ones. Your Advertising Cost of Sales improves but your total profit collapses.
The correct approach is optimizing at search term level, not keyword level. Download the Search Term Report, identify the 5 unprofitable search terms, negate those specific terms, and keep the keyword active for the 45 profitable terms.
The tools gave you keywords. Now you need a framework for identifying which search terms those keywords actually trigger, and which of those search terms are profitable. This requires understanding how Amazon actually matches search queries to your ads - and the answer is not what you think.
How Amazon Matching Actually Works (Consolidated Search Term Level)
Stop Words and the Negation Trap
Amazon ignores stop words in matching. Stop words are words like of, by, for, with, and, the that Amazon strips from search queries before matching to your keywords. This affects both positive matching (when your ads show) and negative matching (when you block search terms).
The negation trap works like this: You discover box of sweets has 0 conversions from 20 clicks. You add box of sweets as an exact match negative keyword to stop wasting money. Amazon now blocks ALL variations that match after stripping stop words.
Amazon blocks box sweets (which was profitable: 5 sales, 15% Advertising Cost of Sales). Amazon blocks sweets box (which was profitable: 3 sales, 18% Advertising Cost of Sales). Amazon blocks box for sweets (which was profitable: 2 sales, 20% Advertising Cost of Sales). Amazon blocks boxes sweet, sweet box, box and sweets, box with sweets, and 8 more variations.
You just killed $800 per month in profit trying to save $50. The Search Term Visibility Trap is invisible in your campaign dashboard because Amazon doesn’t tell you which search terms were blocked by your negative matching.

Flowchart diagram showing how negating the exact match keyword ‘box of sweets’ accidentally blocks 15 profitable search term variations including ‘box sweets’, ‘sweets box’, ‘box for sweets’ due to Amazon ignoring stop words and treating singular/plural as identical, resulting in $535 monthly lost revenue while trying to save $50, with correct approach highlighted to negate at Consolidated Search Term Level
Singular vs Plural Consolidation
Amazon treats singular and plural as functionally identical in matching. Wireless earbud and wireless earbuds are not separate targets. They pool impressions and compete in the same auctions.
This creates two problems for optimization. First, you cannot negate one without affecting the other. If you negate wireless earbud, you also block wireless earbuds. Second, performance data is split across variations in the Search Term Report, hiding true profitability.
Your Search Term Report shows wireless earbud as one row and wireless earbuds as a separate row. Each row has different impression counts, click counts, sales, and spend. You must consolidate the data to see actual performance.
This is the definition of Consolidated Search Term Level: a refinement of the most granular search term level which creates the combined impressions, clicks, sales and spend values taking into account how Amazon treats singular and plural as identical.
Why You Must Optimize at Consolidated Search Term Level
The Search Term Report shows unconsolidated data by default. This creates misleading performance views that cause bad optimization decisions.
Example scenario: Wireless earbud shows 100 impressions, 5 clicks, 1 sale, $10 spend, 50% Advertising Cost of Sales. Wireless earbuds shows 500 impressions, 15 clicks, 2 sales, $20 spend, 66% Advertising Cost of Sales.
The unconsolidated view makes both variations look unprofitable. You might negate both terms thinking they’re wasting money.
The consolidated view combines the data: 600 impressions, 20 clicks, 3 sales, $30 spend, 60% Advertising Cost of Sales. After consolidation, if your break-even Advertising Cost of Sales is 35%, the term is still unprofitable but you have MORE data for a correct decision. You also see the full scale of traffic you’d lose by negating.
The critical rule: Never optimize at keyword level with broad or phrase match. Always optimize at consolidated search term level. This is the only way to see which specific customer searches are profitable versus unprofitable.
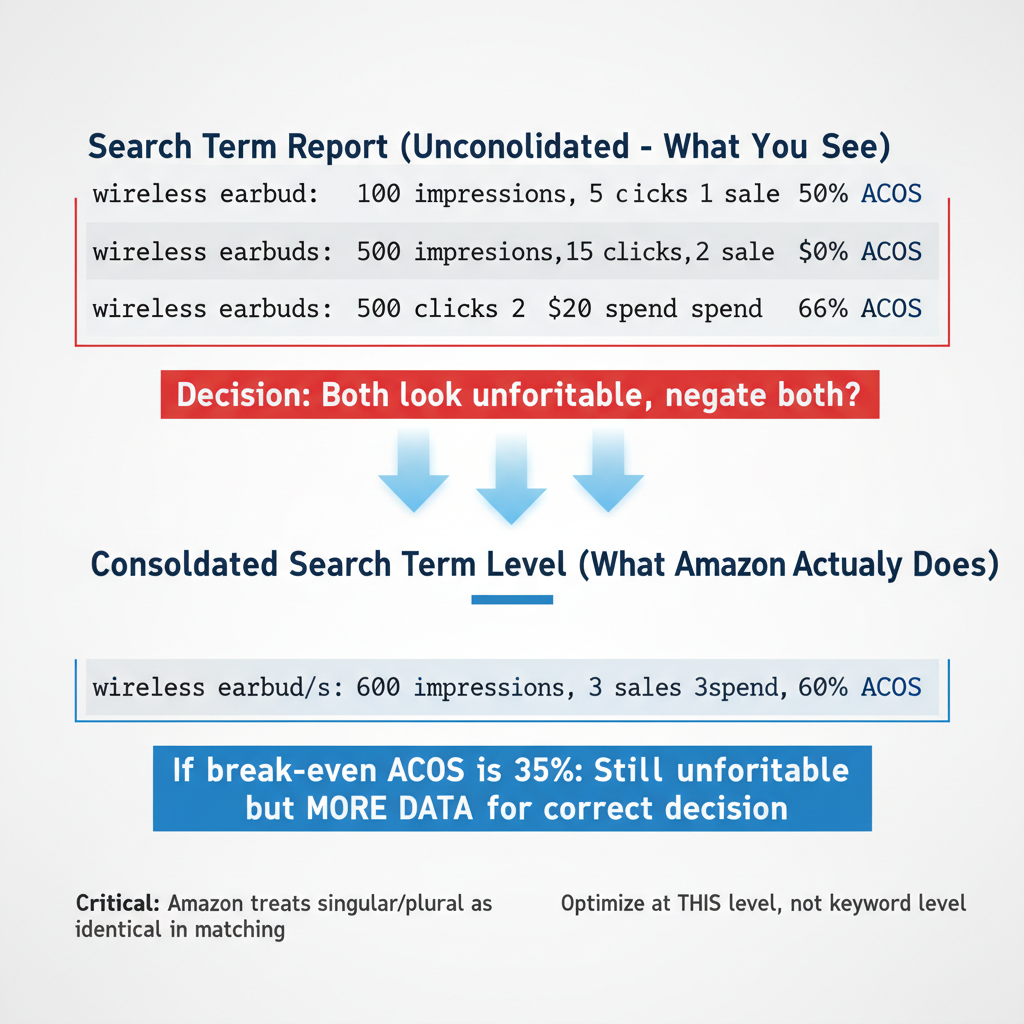
Two-tier comparison showing Amazon Search Term Report unconsolidated data with separate rows for ‘wireless earbud’ at 50% Advertising Cost of Sales and ‘wireless earbuds’ at 66% ACoS appearing unprofitable, versus Consolidated Search Term Level view combining both into single row with 600 total impressions, 20 clicks, 3 sales, 60% ACoS providing more accurate data for optimization decisions, demonstrating Amazon treats singular and plural as identical in matching behavior
The Right Profitability Metrics (Beyond Advertising Cost of Sales)
Why Advertising Cost of Sales is a Poor Optimization Metric
Advertising Cost of Sales is defined as ad spend divided by sales from ads. The formula is simple: if you spend $30 on ads that generate $100 in sales, your Advertising Cost of Sales is 30%.
Advertising Cost of Sales measures ad efficiency in isolation. But it ignores four critical factors that determine whether your advertising is actually profitable.
First, Advertising Cost of Sales ignores product profitability. Your margin after all Amazon fees determines whether a given Advertising Cost of Sales is profitable. Second, Advertising Cost of Sales ignores organic sales impact. Advertising drives brand awareness, reviews, and ranking improvements that generate organic sales. Third, Advertising Cost of Sales ignores lifetime customer value. A customer acquired through ads may purchase repeatedly. Fourth, Advertising Cost of Sales ignores inventory velocity goals. Moving inventory quickly sometimes matters more than immediate profit margin.
The universal Advertising Cost of Sales trap is following blog advice to target 20-30% Advertising Cost of Sales. This assumes all products have similar margins. In reality, a good Advertising Cost of Sales depends entirely on YOUR product margin after all Amazon fees.
Consider two products both running at 25% Advertising Cost of Sales. Product A has 50% margin after all fees. A 25% Advertising Cost of Sales is very profitable because you keep 25% profit after ad costs. Product B has 20% margin after all fees. A 25% Advertising Cost of Sales is losing money because ad costs exceed your margin.
There is no universal target Advertising Cost of Sales. You must calculate your specific break-even point.
Calculating Your Break-even Advertising Cost of Sales
Break-even Advertising Cost of Sales is the Advertising Cost of Sales percentage at which advertising profit exactly equals advertising spend. It’s calculated based on product gross margin after all Amazon fees.
Amazon’s fee structure significantly impacts your margin. Consider a product that sells for $30. Amazon Referral Fee is typically 15%, which is $4.50. FBA Fee varies by size and weight, but assume $5.50 for this example. Cost of goods is $10.
The calculation: Sale price $30 minus Amazon Referral Fee $4.50 minus FBA Fee $5.50 minus cost of goods $10 equals actual profit per sale of $10. Gross margin is $10 divided by $30, which equals 33%. Your break-even Advertising Cost of Sales is 33%.
This means any Advertising Cost of Sales below 33% generates profit. Any Advertising Cost of Sales above 33% loses money. The blog post telling you to target 20% Advertising Cost of Sales might be costing you sales if your actual break-even is 40%. Or it might be losing you money if your actual break-even is 18%.
Amazon can take up to 50% of the final sale price in fees before you see profit. A $20 product might have $3 referral fee plus $6 FBA fee plus $8 cost of goods, leaving only $3 profit (15% margin). Your break-even Advertising Cost of Sales is 15%. Running ads at 20% Advertising Cost of Sales loses money on every sale.
The formula for break-even Advertising Cost of Sales: Sale Price minus Amazon Referral Fee minus FBA Fee minus Cost of Goods, divided by Sale Price, multiplied by 100.
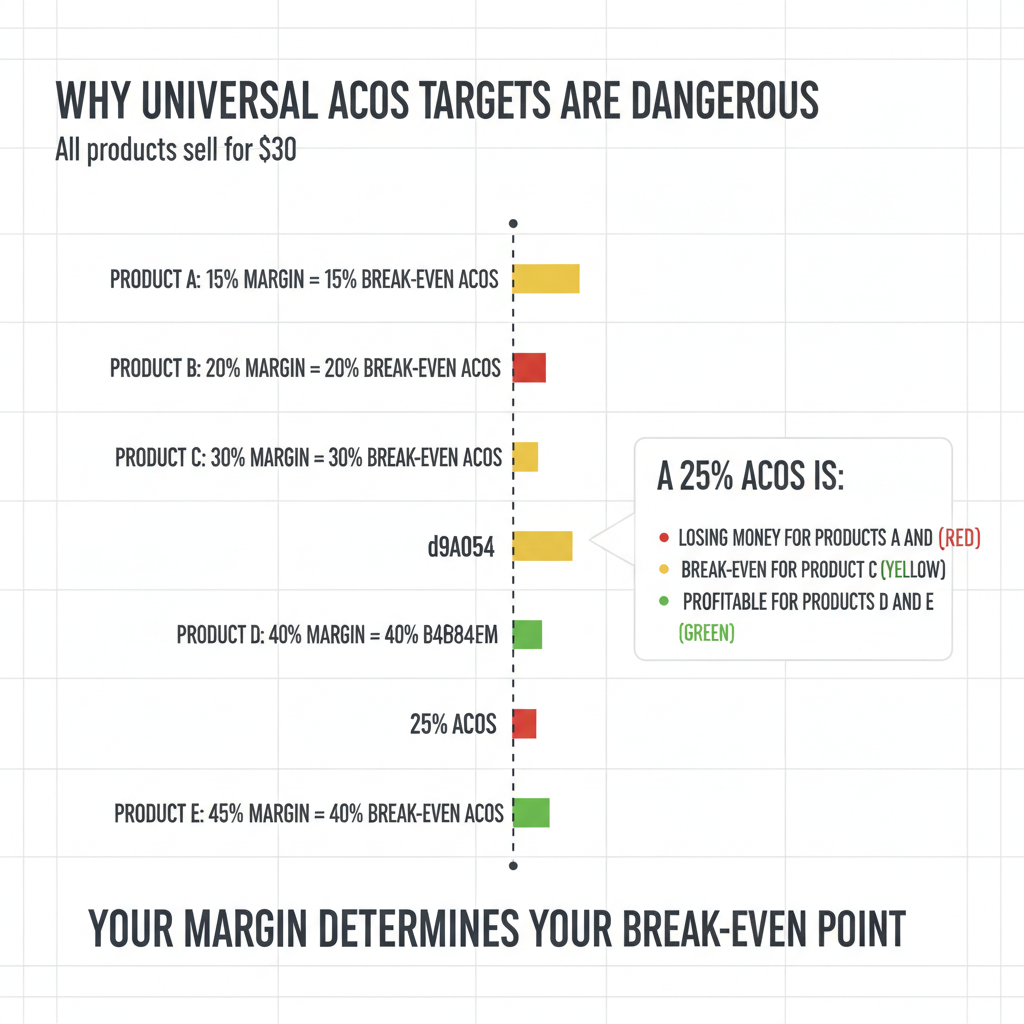
Bar chart showing five Amazon products all priced at $30 but with different margins from 15% to 45%, demonstrating how a universal 25% Advertising Cost of Sales target is losing money for low-margin products, break-even for 30% margin product, and profitable for high-margin products, proving break-even ACoS must be calculated individually based on product margin after Amazon fees
Total Advertising Cost of Profit vs Advertising Cost of Sales (The Better Metric)
Total Advertising Cost of Profit is defined as advertising spend relative to the organic plus advertising profit (not sales). This metric accounts for what Advertising Cost of Sales ignores: the total business impact of your advertising.
Total Advertising Cost of Profit is superior because it accounts for organic sales (the advertising halo effect) and measures against profit rather than sales. When you run ads, customers see your product, some buy via ads, and others buy organically after seeing your ad or reading reviews from ad-driven sales.
Example comparison: A campaign running at 30% Advertising Cost of Sales looks marginal. But organic sales doubled from $2,000 to $4,000 per month after advertising started. The Total Advertising Cost of Profit calculation includes this organic lift.
Before ads: $2,000 organic sales, 30% margin, $600 organic profit. After ads: $1,000 ad spend, $3,333 ad sales, $4,000 organic sales (doubled), total sales $7,333. With 30% margin, total profit is $2,200 (from sales) minus $1,000 (ad spend) equals $1,200 net profit. Total Advertising Cost of Profit is $1,000 divided by $2,200, which equals 45%.
The advertising is highly profitable when organic lift is included, even though the 30% Advertising Cost of Sales appeared only marginal.
Total Advertising Cost of Sales is worth mentioning for context. Total Advertising Cost of Sales equals ad spend divided by total sales (organic plus ad sales). It’s an improvement over Advertising Cost of Sales because it includes organic sales in the denominator. But it still measures against sales, not profit. Total Advertising Cost of Profit is the most accurate metric.
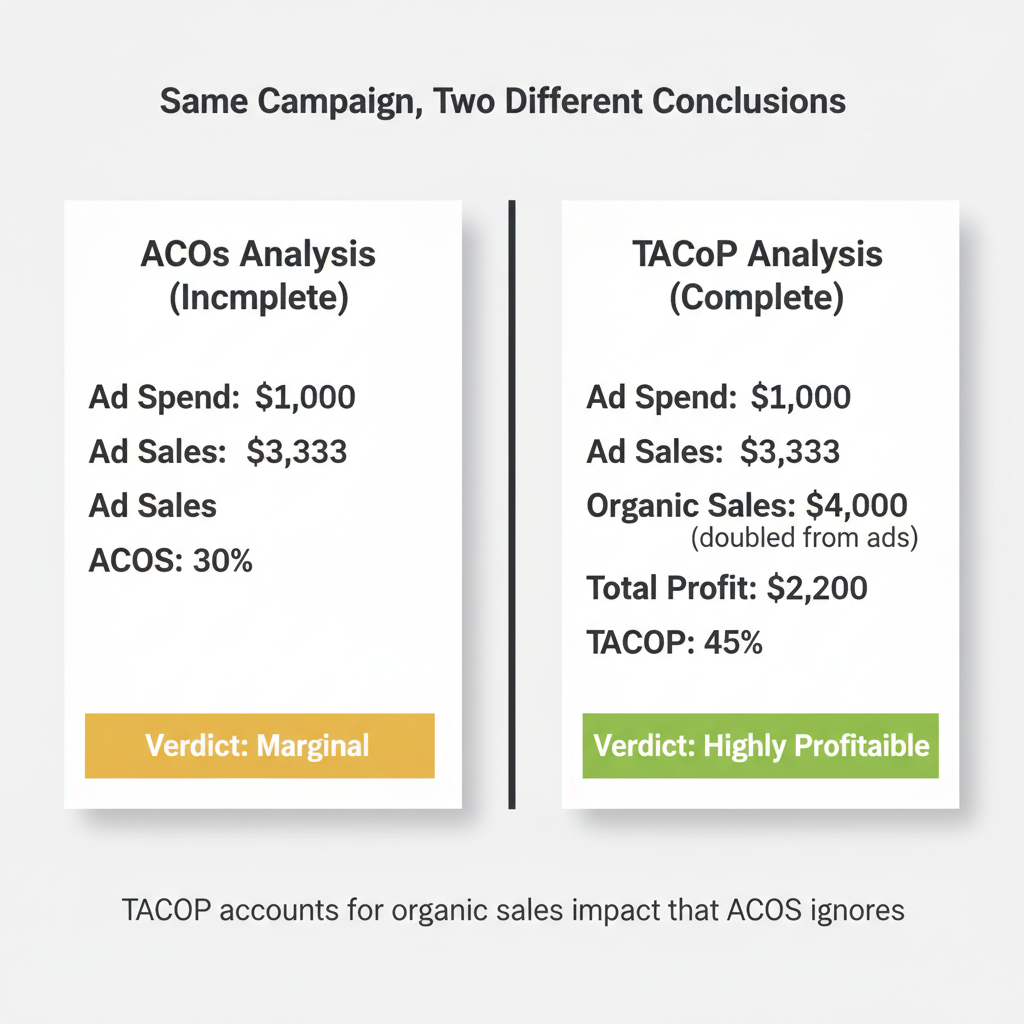
Split-screen comparison showing same Amazon advertising campaign analyzed with Advertising Cost of Sales showing 30% ACoS appearing marginal versus Total Advertising Cost of Profit analysis revealing 45% TACoP but highly profitable when organic sales doubled from $2,000 to $4,000 are included, demonstrating how ACoS ignores organic lift while TACoP accounts for total business impact
Total Profit (The Ultimate Metric)
Absolute profit trumps percentages every time. You can have a beautiful Advertising Cost of Sales percentage and still make less money than a campaign with ugly Advertising Cost of Sales.
Consider this scenario. Campaign A runs at 15% Advertising Cost of Sales with $5,000 ad spend and generates $1,500 total profit. Campaign B runs at 30% Advertising Cost of Sales with $8,000 ad spend and generates $2,400 total profit.
Campaign B has worse Advertising Cost of Sales but generates 60% more profit. Which campaign would you rather run?
The decision framework is simple: Would you rather have a good Advertising Cost of Sales or more money? Most sellers choose the percentage because that’s what the dashboards emphasize. Smart sellers track the dollar amount because that’s what deposits into their bank account.
The contrarian core message: Reducing Advertising Cost of Sales is a terrible goal. You can reduce Advertising Cost of Sales to 0% by turning off all ads. The real goal is maximizing total profit, which often means accepting higher Advertising Cost of Sales on some search terms while eliminating others entirely.
Interactive Total Advertising Cost of Profit Calculator
Calculate your true profitability and break-even point using your specific product economics and campaign performance.
TACoP Profitability Calculator
Calculate your true profitability and break-even point
Percentage fee Amazon takes from each sale (typically 8-15% depending on category)
Fulfillment by Amazon fee charged per unit for storage, picking, packing, and shipping
This calculator reveals the exact dollar amount you can spend per sale while remaining profitable. Most sellers use generic Advertising Cost of Sales targets (20%, 30%) without knowing their actual break-even point, which varies based on product margins and Amazon fees.
The Multiple Products Per Ad Group Trap
Why Attribution Becomes Impossible
Putting 5-10 products in one ad group seems efficient. You can target the same keywords for multiple products and manage fewer ad groups. This common beginner practice destroys your optimization capability.
The attribution problem: Search term wireless earbuds gets 100 clicks in your ad group. Three sales result. Which product got the sales? You don’t know. Which product’s listing is converting? You cannot tell. Which product should you optimize? Impossible to determine.
The mathematical proof: Product A has 40% margin. Product B has 20% margin. Your ad group Advertising Cost of Sales is 25%. Is this profitable? You cannot calculate the answer without knowing which product drove sales. If Product A drove all sales, you’re profitable. If Product B drove all sales, you’re losing money. The aggregate data is meaningless.
Metrics You Lose with Multiple Products
You cannot calculate per-product Click Through Rate. Click Through Rate shows what percentage of impressions result in clicks. It measures whether your product image is compelling. With multiple products, you cannot determine which product image customers clicked.
You cannot calculate per-product Conversion Rate. Conversion Rate shows what percentage of clicks result in orders. It measures whether your listing converts browsers into buyers. With multiple products, you cannot determine which listing converted.
You cannot calculate true Advertising Cost of Sales per product. The aggregate Advertising Cost of Sales is useless for optimization because different products have different margins.
You cannot test improvements. Change the main image on Product A. You cannot measure if Click Through Rate improved because you don’t have Product A’s isolated Click Through Rate. Update bullets on Product B. You cannot measure if Conversion Rate improved for the same reason.
You cannot scale what works. Your ad group performs well. Which product should you buy more inventory for? You’re guessing. Your ad group performs poorly. Which product should you fix or discontinue? You’re guessing.
The Fix (Single Product Ad Groups)
Restructure to one product per ad group. This is non-negotiable for serious optimization.
The benefits are immediate. Clear attribution tells you which product drove clicks and sales. Accurate per-product metrics show Click Through Rate, Conversion Rate, and true Advertising Cost of Sales. Testable improvements let you isolate variable changes and measure results. Scalable winners can be identified and replicated.
The effort concern is real. Splitting ad groups creates more ad groups to manage. But unmanageable data is worse than more structured data. You cannot optimize what you cannot measure. Proper structure enables automation and delegation later.
Search Term Decision Frameworks (What to Actually Do)
Every search term falls into one of two categories: zero-sales search terms (impressions and possibly clicks, but no conversions) or too-expensive search terms (sales, but unprofitable Advertising Cost of Sales). Different diagnostic and action frameworks apply to each category.
Framework 1: Zero-Sales Search Terms
Use this decision tree when a search term has impressions or clicks but zero sales.
Step 1: Check impression count. If impressions are under 500, you have insufficient data. Take no action yet. Wait for more traffic. If impressions are 500 or more, proceed to Step 2.
Step 2: Check Click Through Rate. If clicks are zero, you have an image or title problem. Low Click Through Rate means customers saw your ad but didn’t click. Fix your main image to make it more compelling. Improve your title to match search intent. Do NOT negate the search term because the traffic is relevant but your listing has a visibility problem. If clicks are present, proceed to Step 3.
Step 3: Check search term value. Assess whether the search term has high volume and high commercial intent (high-value) or low volume and low commercial intent (low-value).
For high-value search terms, fix your listing. Customers clicked but didn’t buy, indicating low Conversion Rate. The traffic is valuable but your listing needs work. Improve bullet points to address objections. Enhance A+ content to increase Perceived Value. Perceived Value is the value customers attribute to the product based on listing elements (image, bullet points, A+ content) beyond the factual product value. The optimization goal is perceived value exceeding actual price. Build more reviews through legitimate means. Check pricing against competitors. Do NOT negate high-value search terms just because current Conversion Rate is low.
For low-value search terms, negate at consolidated search term level. Low volume and low intent mean this traffic won’t drive significant revenue even with perfect Conversion Rate. Remember to consolidate singular and plural variations before negating. Remember the stop word risks.
The key principle: Zero-sales terms are often listing problems, not keyword problems. Negating zero-sales terms wastes the expensive research Amazon’s ad platform conducted for you.
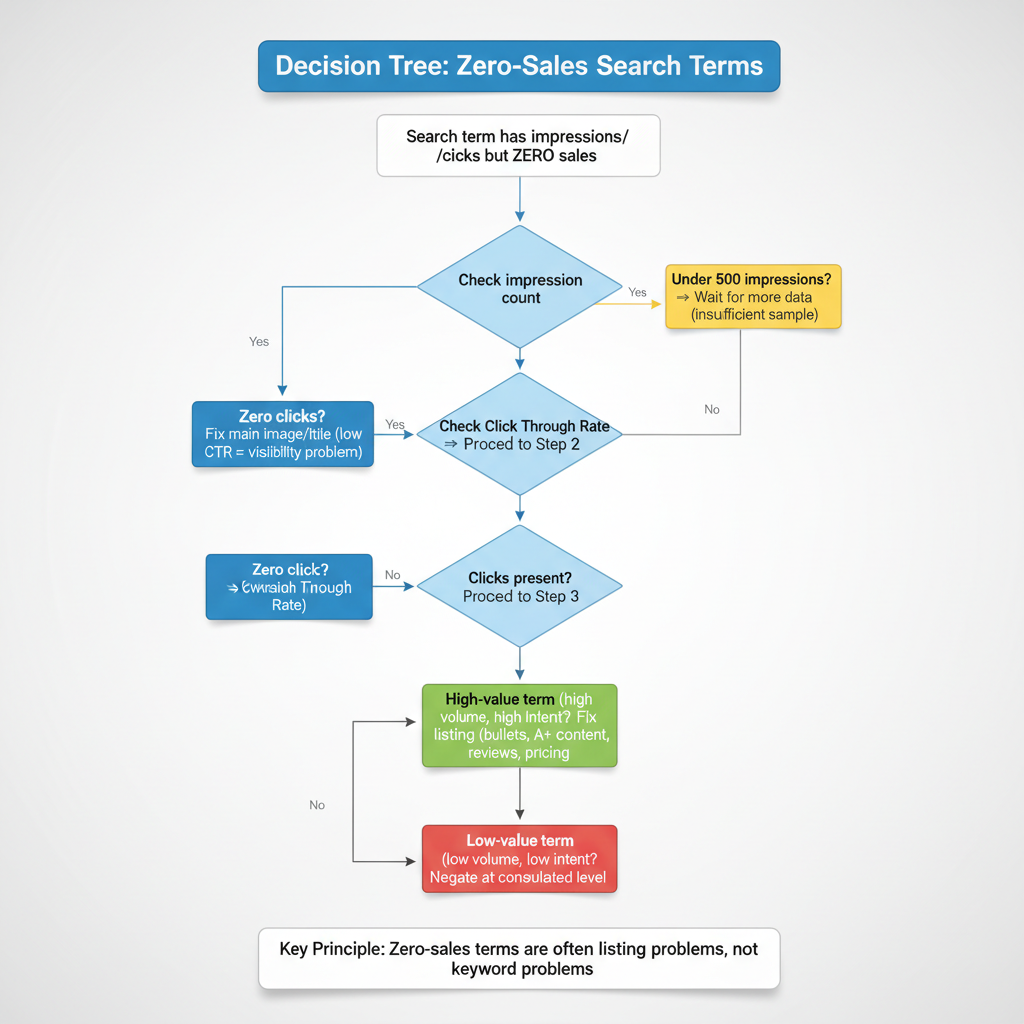
Vertical decision tree flowchart for diagnosing zero-sales search terms in Amazon advertising, starting with impression count check (under 500 wait for data, 500+ continue), then Click Through Rate assessment (zero clicks means fix main image and title for visibility, clicks present continue), then search term value evaluation (high-value terms need listing fixes like bullets, A+ content, reviews, low-value terms should be negated at Consolidated Search Term Level), emphasizing zero-sales are often listing problems not keyword problems
Framework 2: Too-Expensive Search Terms
Use this decision tree when a search term has sales but Advertising Cost of Sales exceeds your break-even point.
Step 1: Check if Advertising Cost of Sales exceeds break-even. If Advertising Cost of Sales is below your break-even Advertising Cost of Sales (calculated earlier), the term is profitable. Take no action. If Advertising Cost of Sales is above break-even, proceed to Step 2.
Step 2: Check sample size. If you have fewer than 5 sales, you have insufficient data. Variance is too high with small samples. A search term with 2 sales at 60% Advertising Cost of Sales might stabilize at 35% Advertising Cost of Sales with more data. Wait for more sales before making decisions. If you have 5 or more sales, proceed to Step 3.
Step 3: Check search term value. Assess whether this is a high-value search term (high volume, high commercial intent) or low-value search term (low volume, low commercial intent, no clear path to improving Conversion Rate).
For high-value search terms, reduce bid or fix listing to improve Conversion Rate. Do NOT negate immediately because the search term has potential for profitability with optimization. Test improving Perceived Value to increase Conversion Rate. Higher Conversion Rate at the same cost per click reduces Advertising Cost of Sales. Alternatively, reduce your bid by 20-30% to lower cost per click. Monitor for 14 days to see if Advertising Cost of Sales drops below break-even at the lower bid.
For low-value search terms with no Conversion Rate improvement path, negate at consolidated search term level. If the search term has low volume, low intent, and your listing is already optimized, further investment won’t generate returns. Ensure you’ve consolidated singular and plural variations before negating to avoid blocking profitable related terms.
The key principle: Too-expensive terms may be fixable with listing improvements or bid adjustments. Check value before negating. High-value traffic deserves optimization effort before elimination.
The Listing Quality Diagnostic
Determining whether poor performance is a keyword problem or listing problem requires metric analysis.
Low Click Through Rate (under 0.3%) indicates an image or title problem, not a keyword problem. Customers see your ad in search results but don’t click. Your main image isn’t compelling enough or your title doesn’t match search intent. The traffic is relevant but your creative needs improvement.
High Click Through Rate but low Conversion Rate (under 5%) indicates a listing conversion problem, not a keyword problem. Customers click because your image and title are compelling, but don’t buy after viewing the full listing. Your bullet points don’t address objections, your A+ content doesn’t demonstrate value, your price is too high, or your reviews are insufficient.
Low Click Through Rate AND low Conversion Rate indicates irrelevant traffic, which is a keyword problem. Customers aren’t clicking and the few who do aren’t buying. The search term doesn’t match your product. Negation is safe in this case.
The action matrix: If you have a listing problem, fix the listing before negating any search terms. Negating good traffic because your listing is broken wastes valuable keyword discovery. If you have a keyword problem (truly irrelevant traffic), negation is the correct action at the consolidated level.
The critical insight: Most sellers negate good traffic and blame keywords when the listing is the problem.
Search Term Decision Framework (Comprehensive Table)
| Scenario | Action | Reasoning |
|---|---|---|
| High-Value Search Term with Zero Sales (10+ clicks, 0 orders, relevant to product) | Fix your listing, NOT the keyword. Check CTR and product images/title. Test different main image or bullet points. | High clicks prove the traffic is interested. Zero conversions indicate your listing failed to communicate value or match expectations. Negating the term wastes expensive research Amazon paid for. |
| Low-Value Search Term with Zero Sales (1-3 clicks, 0 orders, marginal relevance) | Negate at consolidated search term level after 30 days. Account for singular/plural variations when negating. | Insufficient data to diagnose listing vs traffic problem. Low click volume suggests weak relevance. Wait 30 days for statistical significance before negating to avoid premature decisions. |
| Search Term Above Break-even ACoS (ACoS exceeds your calculated break-even) | Calculate total profit impact first. If organic sales increased after ads started, keep running. If purely loss-making, reduce bid by 20-30% and monitor for 14 days. | ACoS alone ignores organic lift. Advertising Cost of Sales measures direct attribution but misses halo effect. TACoP (Total Advertising Cost of Profit) accounts for total business impact. High ACoS may be acceptable if driving profitable organic growth. |
| Broad Match Keyword with Mixed Performance (Some search terms profitable, others not) | Never optimize at keyword level. Download Search Term Report, analyze at consolidated search term level, negate specific unprofitable search terms only. | Pausing the broad match keyword kills ALL search terms, including profitable ones. Amazon shows your ad for multiple search variations per keyword. Optimization must happen at the granular search term level to preserve winners. |
| Multiple Products in One Ad Group (Cannot determine which product got clicks/sales) | Split into separate ad groups immediately. One product per ad group. Clone campaign structure for each product. | Attribution becomes impossible with multiple products. You cannot calculate per-product CTR (Click Through Rate), CVR (Conversion Rate), or profitability. Different products have different margins, making ACoS targets meaningless. Testing listing improvements requires isolated data. |
| Exact Match Negative Needed (Want to block specific unprofitable search term) | Warning: Exact match is NOT exact. Negating "box of sweets" also blocks "box sweets," "sweets box," "box for sweets," etc. Negate at consolidated search term level to prevent collateral damage. | Amazon ignores stop words (of, by, for, with, and, the) and treats singular/plural as identical in exact match. A single negative can accidentally block 10-15 profitable search term variations. Consolidate variants before negating to understand full impact. |
| ACoS Reduced but Sales Dropped (Lower percentage but fewer total sales) | Calculate total profit before and after. If total profit decreased, revert optimization changes. Lower ACoS is meaningless if absolute profit declined. | Reducing ACoS is easy: stop all ads and achieve 0% ACoS with $0 profit. The goal is maximizing total profit, not minimizing ACoS percentage. You can reduce ACoS to 15% by cutting high-volume 25% ACoS terms, but if those terms were profitable, total profit drops. |
| Product Launch or Stock Clearance (Strategic objectives beyond immediate profit) | Accept temporary losses above break-even ACoS. For launches: build review velocity and organic rank. For clearance: prioritize cash flow over margin. | Not all campaigns optimize for immediate profitability. Product launches trade short-term ad losses for long-term organic ranking (review count drives organic visibility). Stock clearance prioritizes turning inventory into cash before storage fees or obsolescence costs exceed margin. |
Advanced Campaign Structure Rules
Match Type Strategy
Match type determines how liberally Amazon shows your ad for variations of your keyword.
Broad Match is a match type where Amazon shows your ad for close variations, related terms, and synonyms of your keyword. Use broad match for discovery. Add 10-20 seed keywords in broad match and let Amazon’s algorithm find search terms you wouldn’t think of manually. After 30 days, review the Search Term Report to see which actual searches triggered sales.
Phrase Match is a match type where Amazon shows your ad for search queries containing your keyword phrase in the same order, but may include additional words before or after. Use phrase match for targeted expansion. Once you’ve identified winning search terms from broad match, add them as phrase match to get more controlled traffic at slightly lower cost.
Exact Match is a match type that is NOT actually exact. Amazon ignores stop words and treats singular and plural as identical in exact match. Use exact match for precision control of your highest-performing search terms. Exact match typically has the lowest cost per click but remember it’s not truly exact due to stop word behavior.
The optimization level by match type: Broad and phrase match campaigns MUST be optimized at consolidated search term level. You cannot optimize at keyword level without killing profitable search terms. Exact match only campaigns can be optimized at keyword level with caution for stop words, though search term level is still safer.
Backend Search Terms
Backend Search Terms are hidden keywords in Seller Central that help products appear in search results but are not visible to customers. These keywords don’t appear in your listing but Amazon indexes them for organic search ranking.
The character limit is 249 bytes. Spaces count as bytes. Use every available byte because more relevant keywords increase discoverability.
Best practices: Use backend search terms for synonyms not in your title or bullets. Include common misspellings that customers might type (wireless earbud users might type wireles or wireles earbuds). Include abbreviations and alternate names for your product. Do NOT include punctuation because it wastes bytes. Do NOT repeat keywords already in your title, bullets, or A+ content because repetition provides no additional ranking benefit.
What NOT to include: Brand names (yours or competitors) because Amazon prohibits competitive brand bidding in backend terms. Temporary claims like new, sale, or discount because they expire and you’ll forget to remove them. Anything already visible in your listing because it’s already indexed.
Campaign Organization Best Practices
Single product per ad group is non-negotiable for serious sellers. This bears repeating because it’s the foundation of meaningful optimization.
Separate campaigns by match type for easier management. Create one campaign for broad match discovery, one for phrase match expansion, and one for exact match conversion. This structure lets you adjust budgets and bids based on campaign objective.
Separate campaigns by keyword intent type: Branded campaigns target your brand name plus product (YourBrand wireless earbuds). Competitor campaigns target competitor brand names (CompetitorBrand wireless earbuds). Generic campaigns target non-branded category terms (wireless earbuds). These three intent types have different costs per click and conversion rates, requiring different bid strategies.
Naming convention importance enables filtering and reporting. Use a consistent format like BRAND_ProductName_MatchType_IntentType. This structure lets you bulk edit and analyze campaign groups easily.
When to Break the Rules (Nuance and Variations)
Product Launch Exception
The normal rule is negating unprofitable search terms immediately. The launch exception is accepting temporary losses for ranking and reviews.
New products have no organic rank, which means zero organic traffic. New products have no reviews or few reviews, which means low Conversion Rate (5-8% instead of 15-20%). Early advertising builds sales history (ranking signal), reviews (conversion improvement), and best seller rank (visibility).
It’s acceptable to run at 50-70% Advertising Cost of Sales temporarily during launch phase (4-8 weeks). You’re trading short-term ad losses for long-term organic ranking. Once you have 25+ reviews, shift to profitability optimization using your break-even Advertising Cost of Sales.
Stock Clearance Exception
The normal rule is optimizing for profitability. The clearance exception is when Advertising Cost of Sales becomes irrelevant.
Seasonal inventory must sell before the season ends. A swimsuit in September needs to move regardless of ad cost. Stale inventory incurs long-term storage fees after 365 days. The carrying cost exceeds ad cost.
The decision framework: Ad spend is justified if total revenue (after all fees and ad spend) exceeds cost of goods plus storage fees you’d pay otherwise. A $20 product with $8 cost of goods and $3 pending storage fee means you can spend up to $9 on ads and still come out ahead.
KDP (Kindle Direct Publishing) Variation
Physical products and KDP have different advertising constraints. KDP authors get only 7 keyword slots for organic discovery (versus unlimited campaigns for physical products). KDP has no Search Term Report available. KDP cannot run Sponsored Products ads (different advertising platform).
The KDP keyword research strategy focuses on Amazon autocomplete and competitor analysis. Prioritize exact phrase matches because you cannot use broad matching. Use all 7 slots with highest-volume relevant phrases. Include Backend Search Terms aggressively (same 249 byte limit) because you have limited visible keyword space.
This article focuses on physical products. KDP requires a separate strategy due to platform constraints.
Low-Margin Product Exception
The normal rule is using break-even Advertising Cost of Sales as the threshold. The low-margin exception is when advertising may not be viable at all.
A product with 15% margin after all Amazon fees has a break-even Advertising Cost of Sales of 15%. Achieving 15% Advertising Cost of Sales profitably is extremely difficult in competitive categories. Most established sellers run 25-35% Advertising Cost of Sales.
Alternative strategies for low-margin products: Focus on social proof through review generation programs (within Amazon Terms of Service). Optimize listing for organic conversion without paid traffic. Use external traffic from social media or influencer partnerships. Consider bundling products to improve margin.
Reality check: Some products are too low-margin to advertise profitably on Amazon regardless of keyword strategy.
High-Competition Niche Exception
The normal rule is that long-tail keywords are more profitable for new sellers. The high-competition exception is when even long-tail phrases are saturated.
Niches like supplements, phone cases, and garlic presses have extreme competition. Even 5-word long-tail phrases have 500+ competitors bidding. The normal advantage of long-tail keywords disappears.
Differentiation requirements in high-competition niches: You cannot compete on keywords alone. You must improve Perceived Value dramatically through superior images (professional lifestyle photography), enhanced A+ content (comparison charts, usage demonstrations), higher review count (legitimate review generation), higher review quality (addressing objections in Q&A), and competitive pricing.
Reality check: Some niches are unprofitable for new sellers regardless of keyword strategy. Established sellers with lower cost of goods, higher review counts, and brand recognition have insurmountable advantages.
Common Mistakes to Avoid (Anti-Advice)
Mistake 1: Optimizing at Keyword Level with Broad or Phrase Match
Sellers pause keywords with high Advertising Cost of Sales thinking they’re improving efficiency. This kills profitable search terms hidden in aggregate data.
Example walkthrough: Your broad match keyword bluetooth speaker shows 35% Advertising Cost of Sales in the campaign dashboard. Your target is 30%, so you pause the keyword to reduce Advertising Cost of Sales.
The Search Term Report reveals the keyword triggered these actual searches: bluetooth speaker waterproof (15% Advertising Cost of Sales, 20 sales), bluetooth speaker portable (18% Advertising Cost of Sales, 15 sales), bluetooth speaker with bass (22% Advertising Cost of Sales, 10 sales), bluetooth speaker cheap (80% Advertising Cost of Sales, 3 sales, no profit), plus 20 more search terms that were mostly profitable.
By pausing the keyword, you killed 45 profitable search terms to stop 2 unprofitable ones. Your Advertising Cost of Sales improved but your total profit collapsed.
The correct action is negating the 2 unprofitable consolidated search terms (bluetooth speaker cheap and the other unprofitable one), while keeping the keyword active for the 45 profitable search terms.
Mistake 2: Using Advertising Cost of Sales Targets from Blog Posts
Sellers aim for 20-30% Advertising Cost of Sales because blog posts say this is the target. This ignores individual product profitability.
Product A sells for $50 with $15 margin after all fees (30% margin). At 20% Advertising Cost of Sales, you spend $10 on ads to generate a $50 sale. Your profit is $15 minus $10 ad cost equals $5 net profit. This is profitable.
Product B sells for $50 with $25 margin after all fees (50% margin). At 20% Advertising Cost of Sales, you spend $10 on ads to generate a $50 sale. Your profit is $25 minus $10 ad cost equals $15 net profit. This is highly profitable.
The same 20% Advertising Cost of Sales produces different profit outcomes based on margin. Universal targets are meaningless without knowing your specific break-even point.
The correct action is calculating YOUR break-even Advertising Cost of Sales based on YOUR product margin after all Amazon fees, then using YOUR number as the threshold.
Mistake 3: Negating at Search Term Level Without Consolidation
Sellers see wireless earbud (singular) with 0 sales and negate it immediately. They didn’t check for singular and plural consolidation.
The data shows wireless earbud (singular) had 2 clicks and 0 sales. The data shows wireless earbuds (plural) had 15 clicks and 3 sales at 25% Advertising Cost of Sales. The seller negates the singular variation thinking it’s unprofitable.
Amazon treats singular and plural as identical in matching. Negating the singular automatically blocks the plural. The seller lost 3 sales per week ($450 monthly revenue) by not consolidating data before negating.
The correct action is always consolidating singular and plural variations before negating. If the consolidated data shows the term is unprofitable, then negate both variations intentionally rather than accidentally.
Mistake 4: Celebrating Advertising Cost of Sales Reduction Without Checking Total Profit
Sellers report success when they reduce Advertising Cost of Sales from 40% to 25%. They don’t check if total profit actually increased.
Before optimization: $10,000 ad spend, $25,000 ad sales, 40% Advertising Cost of Sales. With 30% margin, profit is $7,500 from sales minus $10,000 ad spend. Wait, that’s a $2,500 loss. Let me recalculate: $25,000 in sales with 30% margin means $7,500 gross profit before ad costs. After $10,000 ad spend, the net is negative $2,500. This example is confusing because it shows an unprofitable campaign before optimization.
Let me use a clearer example. Before optimization: $10,000 ad spend, $40,000 ad sales, 25% Advertising Cost of Sales, 30% margin means $12,000 gross profit minus $10,000 ad spend equals $2,000 net profit.
After optimization: $5,000 ad spend, $20,000 ad sales, 25% Advertising Cost of Sales (same percentage), 30% margin means $6,000 gross profit minus $5,000 ad spend equals $1,000 net profit.
Wait, the Advertising Cost of Sales stayed the same in this example but I wanted to show it improving. Let me fix this.
Before optimization: $10,000 ad spend, $25,000 ad sales, 40% Advertising Cost of Sales, 30% margin means $7,500 gross profit minus $10,000 ad spend equals negative $2,500 (losing money).
After optimization: $5,000 ad spend, $20,000 ad sales, 25% Advertising Cost of Sales, 30% margin means $6,000 gross profit minus $5,000 ad spend equals $1,000 net profit.
Advertising Cost of Sales improved from 40% to 25%, and the campaign became profitable. But what if organic sales dropped 30% due to reduced advertising halo effect? The seller would lose more in organic profit than they gained in ad efficiency.
The correct action is tracking total profit (ad profit plus organic profit), not just Advertising Cost of Sales percentage.
Mistake 5: Negating Exact Match Without Understanding Stop Words
Sellers negate box of sweets in exact match thinking they’re blocking one specific search term. Amazon ignores stop words and blocks all variations.
The seller intended to block box of sweets (0 sales, unprofitable). Amazon actually blocks box sweets (which had 5 sales monthly at 18% Advertising Cost of Sales), sweets box (which had 3 sales monthly at 20% Advertising Cost of Sales), box for sweets (which had 2 sales monthly at 22% Advertising Cost of Sales), and 12 more variations.
The lost revenue totals $800 per month from blocked profitable terms. The seller tried to save $50 per month from the one unprofitable term.
The correct action is understanding that exact match negation blocks all stop word variations. Negate cautiously after consolidating all variations to understand the full impact of blocking.
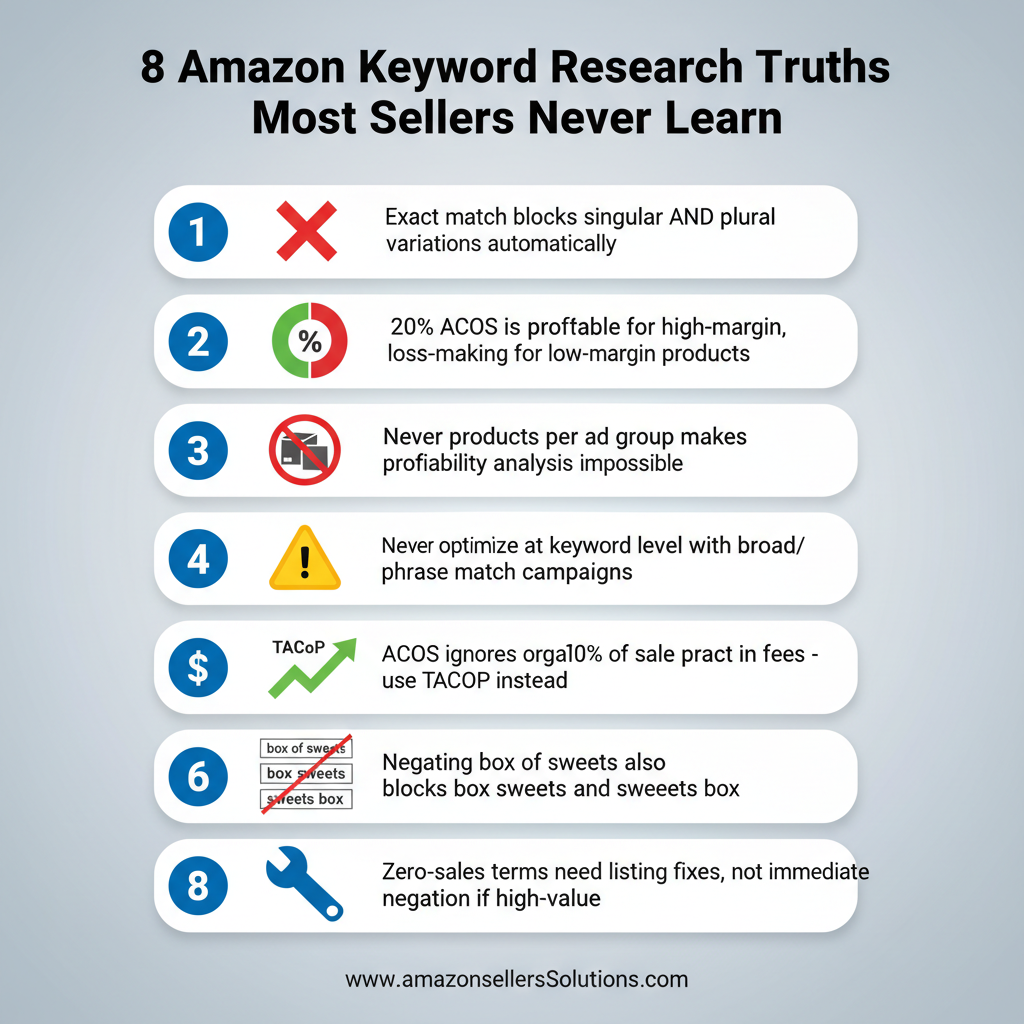
Infographic showing 8 critical Amazon keyword research truths including how exact match blocks plural variations, why 20% ACoS profitability varies by product margin, dangers of multiple products per ad group, keyword-level optimization risks with broad match, TACoP vs ACoS comparison, Amazon fee impact on profitability, stop word negation collateral damage, and zero-sales term diagnosis approach
Step-by-Step Action Plan (Implementation)
Step 1: Calculate Your Break-even Advertising Cost of Sales
Use the Total Advertising Cost of Profit Calculator embedded earlier in this article. Gather the required data from your Seller Central account.
Last 30 days sales (organic plus ad sales) from the Business Reports section. Last 30 days ad spend from Campaign Manager. Product sale price from your listing. Cost of goods from your supplier invoices or manufacturing costs. Amazon fees including referral fee (check your category percentage, typically 8-15%) and FBA fee (check the FBA Revenue Calculator for your product dimensions and weight).
Calculate margin after all fees using the calculator. Determine your break-even Advertising Cost of Sales. Write this number down and use it as YOUR optimization threshold, not generic blog post targets like 20% or 30%.
Step 2: Audit Your Ad Groups for Multiple Products
Export your current campaign structure from Campaign Manager. Download the campaign export file and open in spreadsheet software. Identify ad groups with more than 1 product listed.
Create single-product ad groups for each product currently in multi-product ad groups. Clone the existing ad group structure (same keywords, same match types, same bids). Remove all products except one from each cloned ad group. Repeat for each product that was sharing the ad group. Pause the old multi-product ad group after confirming the new single-product ad groups are active.
Timeline: This restructuring is tedious but essential. Allocate 2-4 hours for a complete account restructure. The optimization capability you gain is worth the effort.
Step 3: Download and Analyze Search Term Report
Navigate to Campaign Manager, then Reports, then Search Term Report. Select date range of last 60 days for sufficient sample size. Export the report to CSV format.
Open in spreadsheet software and create a consolidated search term column. Combine singular and plural variations manually (wireless earbud + wireless earbuds = wireless earbud/s). Remove stop words for matching purposes (box of sweets matches box sweets, sweets box, etc.). Sum impressions, clicks, sales, and spend for each consolidated term group.
Calculate consolidated Advertising Cost of Sales for each term by dividing total spend by total sales. Compare each consolidated Advertising Cost of Sales to your break-even Advertising Cost of Sales from Step 1.
Step 4: Apply Decision Frameworks
Sort consolidated search terms by performance category. Zero-sales terms (impressions and possibly clicks, but no orders) go into one list. Too-expensive terms (sales but Advertising Cost of Sales above break-even) go into another list. Profitable terms (Advertising Cost of Sales below break-even) require no action.
Apply Framework 1 to zero-sales terms. Check impression count, Click Through Rate, and search term value as outlined earlier. Create an action list of terms to negate and listings to fix.
Apply Framework 2 to too-expensive terms. Check sample size, search term value, and optimization potential as outlined earlier. Create an action list of bids to reduce, listings to improve, and terms to negate.
Implement changes in small batches. Change 10-20 terms at a time and monitor results for 7-14 days before the next batch. This prevents overcorrection and lets you measure impact.
Step 5: Shift from Advertising Cost of Sales to Total Profit Tracking
Create a new reporting dashboard in spreadsheet software or your preferred tool. Track these metrics weekly: total ad spend, ad sales, organic sales, total profit (calculated using your margin after fees minus ad spend), Advertising Cost of Sales (for reference only), and Total Advertising Cost of Profit.
Your optimization goal is maximizing total profit, not minimizing Advertising Cost of Sales. Review the dashboard weekly and adjust campaigns based on profit trends, not percentage trends.
Step 6: Ongoing Optimization Cadence
Weekly: Review Search Term Report for new data. Apply decision frameworks to search terms with sufficient sample size. Make 5-10 small optimizations per week.
Monthly: Recalculate break-even Advertising Cost of Sales if costs or fees changed. Amazon updates FBA fees periodically. Your supplier costs may change. Keep your break-even calculation current.
Quarterly: Audit campaign structure for optimization opportunities. Consolidate learnings into new campaign structures or testing hypotheses.
Continuously: Test listing improvements for high-value low-Conversion Rate search terms. A better main image or revised bullet points can turn unprofitable traffic into profitable traffic.
Tools and Resources
Free Tools Recap
Amazon Product Opportunity Explorer is available in Seller Central under the Growth menu. It shows trending search terms and niche opportunities.
Amazon Search Query Performance Dashboard displays search query metrics across your category in Seller Central.
Amazon Search Term Report is downloadable from Campaign Manager under Reports. It shows actual customer searches that triggered your ads.
Amazon Autocomplete is the search bar suggestions when you type on Amazon.com. Manual but effective for finding variations.
Sonar by Sellics is a free keyword research tool at https://sonar-tool.com/us/. It provides keyword suggestions with estimated search volumes.
Keyword Tool Dominator offers a limited free version at https://www.keywordtooldominator.com/amazon-keyword-tool.
Paid Tools Recap
Helium 10 offers comprehensive keyword research at https://www.helium10.com/ starting at $99 monthly. Features include Magnet for seed keyword research and Cerebro for competitor ASIN analysis.
Jungle Scout provides keyword research and competitor tracking at https://www.junglescout.com/ starting around $99 monthly.
Viral Launch offers similar features at https://viral-launch.com/ with various pricing tiers.
AMZScout provides keyword tools at https://www.amzscout.net/ with monthly and annual plans.
Tools are useful for discovery but cannot replace profitability analysis. No tool tells you which search terms are profitable for YOUR specific product at YOUR specific margin.
Interactive Calculator
The Total Advertising Cost of Profit Calculator embedded earlier in this article calculates your true profitability. Bookmark this page and recalculate whenever your costs or fees change. Understanding your break-even point is the foundation of profitable advertising.
Recommended Further Reading
Amazon Advertising API documentation for advanced users who want to automate bid management and reporting.
Amazon Seller Central help documentation on match types explains official Amazon guidance on broad, phrase, and exact match behavior.
Frequently Asked Questions
What is the best free keyword research tool for Amazon?
Amazon’s own Product Opportunity Explorer and Search Term Report are the best free options because they use actual Amazon data (not estimates). For third-party tools, Sonar by Sellics is the most comprehensive free option. However, finding keywords is only 20% of the work. The critical part is analyzing which search terms are profitable using the consolidated search term level frameworks in this article.
Should I use broad, phrase, or exact match keywords?
Use broad match for discovery (finding new search terms via Search Term Report). Use phrase match for targeted expansion of proven winners. Use exact match for precision control of your highest-performing terms. However, understand that exact match is not actually exact. Amazon ignores stop words and treats singular and plural as identical. The more important rule is never optimizing at keyword level if you use broad or phrase match. Always optimize at consolidated search term level.
What is a good Advertising Cost of Sales for Amazon ads?
There is no universal good Advertising Cost of Sales. It depends entirely on your product’s margin after all Amazon fees. A 20% Advertising Cost of Sales is profitable for a product with 40% margin but loss-making for a product with 15% margin. Calculate your break-even Advertising Cost of Sales using the Total Advertising Cost of Profit calculator in this article, then use YOUR number as the threshold, not generic blog advice.
How do I know if a keyword is profitable?
You don’t optimize keywords. You optimize consolidated search terms. Download your Search Term Report, consolidate singular and plural variations, calculate Advertising Cost of Sales for each consolidated search term, and compare to your break-even Advertising Cost of Sales. If the consolidated search term Advertising Cost of Sales is below your break-even, it’s profitable. If above, apply the too-expensive search terms decision framework to determine if you should fix your listing or negate the term.
Can I put multiple products in one ad group?
Technically yes, but you should not. Multiple products per ad group makes profitability analysis mathematically impossible because you cannot determine which product drove clicks and sales. You cannot calculate per-product metrics (Click Through Rate, Conversion Rate, true Advertising Cost of Sales), cannot test listing improvements, and cannot scale what works. Always use single-product ad groups.
How many keywords should I target?
There’s no magic number. Start with 20-50 relevant keywords across broad, phrase, and exact match types. Let the Search Term Report reveal which actual search terms are driving results. Focus less on keyword count and more on search term profitability analysis. Quality (profitable search terms) beats quantity (keyword count).
Should I use negative keywords?
Yes, but with extreme caution. Amazon’s exact match negation is dangerous because it ignores stop words and treats singular and plural as identical. Negating box of sweets will also block box sweets, sweets box, and 12+ other variations, potentially killing profitable traffic. Always consolidate search terms before negating, and negate at the consolidated level only after confirming the entire consolidated term group is unprofitable.
How long should I wait before negating a keyword?
First, don’t negate keywords. Negate consolidated search terms. Second, it depends on the scenario. For zero-sales terms, wait for at least 500 impressions before taking action. First diagnose if it’s a listing problem (low Click Through Rate or low Conversion Rate) rather than a keyword problem. For too-expensive terms, wait for at least 5 sales to ensure statistical significance. Then apply the decision framework. High-value terms may be fixable with bid reduction or listing improvements rather than negation.
The Keyword Research Reality
Most Amazon sellers treat keyword research as a discovery task. Find keywords, add them to campaigns, move on. The tools and blog posts reinforce this because it’s simple to explain and easy to sell.
But the actual work of profitable keyword targeting happens after discovery. It requires understanding how Amazon’s matching behavior works (stop words, singular and plural consolidation), optimizing at the correct granularity level (consolidated search term, not keyword), using profitability metrics (Total Advertising Cost of Profit, Total Profit) instead of efficiency metrics (Advertising Cost of Sales), and applying diagnostic frameworks to determine whether poor performance is a keyword problem or a listing problem.
You now have the expert framework that most Amazon sellers never learn:
Your break-even Advertising Cost of Sales is unique to YOUR product margin (not a blog post generic target). Exact match is not exact (Amazon ignores stop words and treats singular and plural identically). Never optimize at keyword level with broad or phrase match (you’ll kill profitable search terms). Single-product ad groups are non-negotiable (multiple products make attribution impossible). Advertising Cost of Sales reduction is not the goal (total profit maximization is). Zero-sales terms are often listing problems, not keyword problems. Negation creates collateral damage (consolidate first, negate cautiously).
The sellers who master this framework don’t just find keywords. They systematically identify and scale the search terms that actually make money while eliminating the ones that don’t. The difference shows up in monthly profit, not Advertising Cost of Sales dashboards.
Calculate your break-even Advertising Cost of Sales now, audit your ad groups, download your Search Term Report, and start optimizing for profit instead of percentages.